Optimization of environmental remediation of heavy metals: kinetics and thermodynamic modeling
Abstract
The kinetics and thermodynamics of biodegradable adsorbents prepared with kola nut testa were evaluated to remove Cu2+ and Pb2+ ions from an aqueous solution in the batch procedure. Results showed that percentage removal of Pb2+ was 89.982% for C-KNTR and 90.909% for Ch-KNTR while Cu2+ were 86.782% for C-KNTR and 83.973% for Ch-KNTR, respectively. Metal ion removal decreased with an increase in a concentration above 10 mg. Freundlich isotherm best described the uptake of metal ions with the new adsorbents.Maximum monolayer adsorption capacity (qmax) was (68.144 for C-KNTR-Pb2+, 59.09 for C-KNTR-Cu2+ and 50.247 for Ch-KNTR-Pb2+, 65.186 Ch-KNTR-Cu2+) mg/g, respectively. Pseudo second order with (R2 ≥ 0.995-0.999) best described the kinetics, while Alovich, Avrami and Weber-Morris models suggest that multiple mechanisms were involved in the adsorption process. Negative values for ∆Go and positive values of ∆Ho indicate spontaneity and endothermic nature of the adsorption process. In contrast, the positive value of ∆S ◦ indicates an increase in disorderliness at the solid-liquid interface during adsorption. Physisorption predominated in all the studied processes; hence, desorption efficiency examined follows the order H2O > HCl > CH3COOH.
Keywords
Adsorption Kinetics, Desorption, Isotherms, Ion Exchange Resin, kola-nut testa, Physisorption, Thermodynamics
Introduction
Rapid urbanization and upsurge in industrialization are major source of environmental pollution in the world. Industrial and some house hold wastewater contain inorganic pollutants such as metalloid and heavy metals and numerous organic contaminants such as herbicides, pesticides and personal care product (Li, 2018) (Zeng, 2020) (Zeng, 2020). Metal elements such as lead (Pb), copper (Cu), zinc (Zn) and cadmium (Cd) with over 5 g/cm3 of specific gravity are termed heavy metals. Discharge of these heavy metals from various industrial activities of electroplating, fertilizer, petrochemical and metal finishing industries to the environment course serious deterioration and water pollution which can lead to serious health effect when consumed above standard permissible limit due to its slight solubility, toxicity, bioaccumulation and amplification in humans (Shi, 2020) , (Njoku, 2020) , (Olatunde, 2020). Hence, there is need for effective wastewater treatment before disposal. Waste water treatment process such as precipitation, electrochemical treatment, reverse osmosis, ion-exchange, evaporation, solvent extraction, as well as adsorption with activated charcoal among others, has been studied to remediate metal pollutants from various natural and simulated water over the decades, however, most technique have high operation cost and lack ability to remediate metals at trace level. Therefore, there is increase demand to tap into these abundant biowaste in quest to develop cost-effective, biodegradable and environmentally friendly technique for heavy metal adsorption prior to wastewater disposal (Kolo, 2018); (Agomuo, 2017); (Es-Sahbany, 2019). Kola nut testa (KNT), which otherwise constitute nuisance to the environment have been converted to effective wastewater remediation tool due to presence of strong and weak functional group entrenched in lignin, cellulose and hemicellulose as their basic structural constituents in its lignocellulose materials. Their strong adsorption affinity is due to presence of many binding site in polyol backbone. Investigations on the use of modified and unmodified novel waste material as alternative cationic and anionic adsorbent of heavy metals in industrial effluents have been reported in our previous work (Agboeze, 2020). Synthesized adsorbent of modified KNT successfully removed Pb2+ with percentage removal of 80 % than that of Cu2+ with percentage removal of 70 % respectively. Our focus here is to study the factors effecting the efficacy of the cationic and anion ionic synthesized adsorbents in the removal of a toxic metal (copper and lead) from industrial effluent as well as equilibrium, kinetics and thermodynamic analysis. Reusability were also investigated and reported.
Materials and Methods
Biomass collection and preparation
Fruit of kola nut C. nitida was collected from native farmers processing center of Ajona community, Mbu-Amon in Isi-Uzo local government area of Enugu state. The testa were skillfully dehulled, washed with deionized water, air dried for 2 weeks in the laboratory and subsequently oven dried for 24hrs at 60oC. Kola nut testa (KNT) was thereafter smoothly pulverized to 0.192-1.700 μm particle size. modifications of KNT was reported in our previous work (Agboeze, 2020). Various modified KNT (C-NKT and Ch-NKT) was secured in an air tight container for subsequent usage.
PREPARATION OF TEST SOLUTIONS
PREPARATION OF ELEMENT PRIMARY SOLUTIONS
Two principal stock solutions comprising 10 ppm each of Cu2+ and Pb2+ was prepared by drawing 5 mL from a 1000 ppm standard stock solution of the individual metal ions in HNO3 into a 500 mL volumetric flask with a pipette and diluting to the volume of the flask with deionized water before mixing by inversion. Calibration solutions were then prepared by serial dilution of the respective 10 ppm primary standards. For this purpose, aliquots of 10, 20, 25 and 50 mL respectively were drawn from the individual primary stock solutions and delivered into separate 100 mL volumetric flasks. The solutions were then diluted to volume with deionized water and thoroughly mixed to obtain 1, 2, 2.5 and 5 ppm calibration solutions.
Adsorbent Characterization
Procedures employed in surface chemistry identifications, physicochemical analysis, surface morphology determination were critically examined and presented in our previous studies (Agboeze, 2020).
Adsorption Studies
Some of the key factors greatly effecting adsorption parameters are viz pH, initial metal concentrations, adsorbent dosage, temperature of the surroundings and contact time. Various operational parameters that were investigated in this study to corollate the effect of competing ion on Cu2+ and Pb2+ metal adsorption is as follows: concentration (10-50 mg/L), contact time (20-100 min), pH (4-8), adsorption dosage (2-10 g/ml), and temperature (25-45 ◦C). In general, batch adsorption analysis was carried out in a glass-stoppered, Erlenmeyer flask with 100 mL of working volume and an initial concentration of 10 mg dm-3 of heavy metals concentration. A fixed amount of prepared adsorbent was added to the solution. The flasks were agitated for fixed time with a specified speed on a magnetic stirrer at fixed temperature in temperature-controlled water bath for all the batch experiments. pH of 0.1 M HCl or 0.1 M NaOH was used to adjusted the solutions. At the end of agitation time, residual adsorbent was separated by filtration and metal ion concentration of solutions were obtained using an atomic absorption spectrophotometer (AAS, analyte 400 with detection limit of 0.008 μg/ml and calibrated with series of standard solutions of Cu2+ and Pb2+). The extent and percentage adsorbed were calculated using equation 1.1 and 1.2 below.
1.1
1.2
In the above equation, Ci denotes the initial concentration of heavy metals in waste water before adsorption, Ct is the heavy metal ion concentration after adsorption at time t. V is the volume of aqueous metals used for the adsorption studies in liter, M is the adsorbent weight in g and qt is the quantity of heavy metal ions per unit adsorbent after desorption (mg g-1) (Chatterjee, 2019).
Desorption experiment
Eluents used for these studies are 0.2 M CH3COOH, deionized water, 0.2 M HCl. Adsorbent (0.2 g) dosage was added to 10 mg dm-3 of each eluent in a test tube, a temperature-controlled water bath set at 170 rpm for 100 min at 30 °C temperature was used to agitate the mixture. The desorbed heavy metal ion was subsequently analyzed using AAS, analyte 400 and desorption efficiency calculated with equation (1.3) below;
1.3
The Af and Ai in the equation above denotes the capacity of adsorption of the adsorbent after regeneration (mg g-1) and the original adsorption capacity of the adsorbent (mg g-1) respectively (Sun, Jiang, & Xu, 2009).
Modeling of Adsorption Data
Isothermal Studies
Isotherm studies are mathematical models we used to better understand mechanism and method of distribution of adsorbate uptake between liquid and adsorbent (KNT) species based on assumption that mainly related to interaction of adsorbate, homogeneity and heterogeneity of adsorbents. Equilibrium analysis of adsorption relationship between the adsorbent (KNT) concentration in effluent and concentration of adsorbate at stipulated conditions was studied using Langmuir (Langmuir, 1916), Freundlich (Freundlich, 1906), Temkin (Temkin, 1940), Redlich – Peterson (Ayawei, 2017) and Sips (Saadi, 2015) isothermal methods.
Various equations below explain the isotherm models in detail. Equation 1.4a-1.4b depicts Langmuir equation and its linearized form with 1.4c showing equation of its dimensionless factor (RL) respectively.
Equations (1.5a, & b) – (1.6a, & b) are the main and linearized equations of Freundlich and Temkin models correspondingly.
(1.4a)
(1.4b)
(1.4c)
(1.5a)
(1.5b)
(1.6a)
(1.6b)
Where (1.6c)
(1.7)
(1.8)
Ce is concentration obtained at equilibrium in mg/L, qe is the amount of Pb2+ and Cu2+ taken onto the adsorbent surface at equilibrium (mg/g), qmax is the Langmuir maximum monolayer adsorption capacity of adsorbent expressed in mg/g and KL is the Langmuir constant of adsorption calculated in L/mg. and n are Freundlich constants which incorporates the factors affecting the adsorption capacity and adsorption intensity respectively. A is Temkin isotherm constant (L/g), from the value of Temkin constant B, a constant b (J/mol) related to the heat of absorption can be obtained with the relation B=RT/b, T is the temperature expressed in (K), R is the general gas constant (8.314 J/mol K). Where, Redlich – Peterson parameters in equation (1.7) KR/aR=KF and (1-β) = 1/n of Freundlich isotherm model. It reduces to Langmuir equation when β=1, aR=b (Langmuir adsorption constant), and KR=bQ˳, and it reduces to Henry’s equation when β=0 and Henry’s constant is represented by 1/(1+b) in Redlich – Peterson model.
Thermodynamic Adsorption Studies
To study the feasibility of adsorption processes, the thermodynamic parameters, such as Gibbs free energy ΔGo, enthalpy ΔHo, and entropy ΔSo changes can be estimated from the following equations (Kumar, 2011).
(1.7)
(1.8)
(1.9a)
where R is the gas constant, T is the temperature in Kelvin and Van ‘t Hoff enthalpic can be obtained from qe/Ce. ∆Ho and ∆So can be obtained from the plot of ln versus 1/T.).
The activation energy Ea for the adsorption was determined using the Arrhenius equation below:
(1.9b)
where k 1 is the biosorption rate constant, A is the Arrhenius constant, Ea is the activation energy (kJ mol−1), R is the gas constant (8.314 J mol−1 K−1), and T is the temperature (K).
Kinetics Model
Kinetics were studied using the pseudo-first-order, otherwise called Lagergren (Lagergren, 1898), (Qureshi, 2020), pseudo-second-order (Ys & Mckay, 1999), (Tang, Ran, Li, Zhang, & Xiang, 2020), Elovich (Ayawei, 2017) , Avrami (Rojas, Suarez, Moreno, Silva-Agredo, & Torres-Palma, 2019), (Weber & Morris, 1963), kinetic models. The equations (8) – (14) below represents respective form of their linear equations. (1.10)
(1.11)
(1.12)
(1.13)
(1.14)
Results
Studies of operational parametric effects on Lead (Pb) and copper (Cu) adsorptions.
Effect of Initial Concentration on Percentage Adsorption
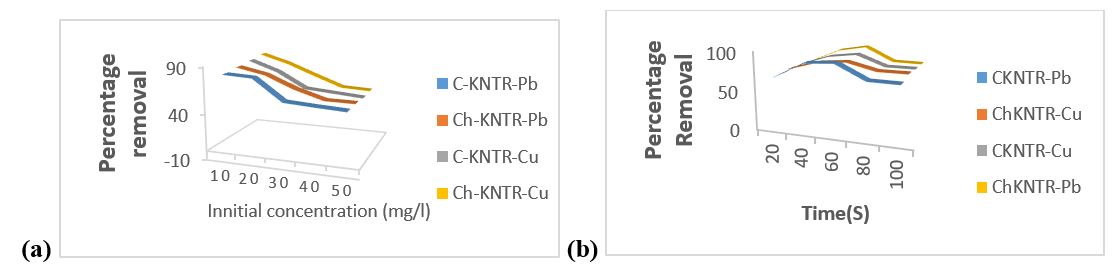
Degree of adsorption is a function of adsorbent initial concentration as shown from the findings on examined varying concentrations data of Pb2+ and Cu2+ ions depicted in figure 3.1(a) below. The effect of varying Pb2+ and Cu2+ ion concentration is highly important because it will aid insight in C-KNTR and Ch-KNTR effectiveness during industrial large-scale production and applications. The result showed that adsorption efficacy of C-KNTR and Ch-KNTR decreased with increase in initial concentration of both Pb2+ and Cu2+ ions from 10-50 mg/L. The decrease in adsorption percentage is due to saturation of available limited number of active sites on adsorbent as heavy metals concentration increases (Chaudhary, et al., 2019; Oluwasola, et al., 2019). The highest optimum adsorption occurred at 10 mg/L concentration with adsorption percentage of (81.267 % for C-KNTR-Pb2+, 83.258 % for Ch-KNTR-Pb2+) and (85.369 % for C-KNTR-Cu2+ and 87.879 % for Ch-KNTR-Cu2+) respectively.
Effect of Contact Time
Figure 3.1(b) below illustrates result of the effect contact time exerted on the percentage of Pb2+ and Cu2+ removal by C-KNTR and Ch-KNTR studied. Adsorption efficiency of metals studied was quick at the beginning of contact time due to increased surface area and presence of copious adsorptive reactive sites present on the adsorbent and then followed a slow but steady increase of adsorption with time until equilibrium was attained at 60 min, beyond which there was noticeable significant decrease in the adsorption with contact time until 80 min, after which there was no significant increase or decrease of adsorption rate with time (Khalek, 2019), (Thakur, 2020). The percentage adsorption at 60 min agitation are (89.982 % for C-KNTR-Pb2+, 90.909 % for Ch-KNTR-Pb) and (86.782 % for C-KNTR-Cu2+ and 83.973 % for Ch-KNTR-Cu2+) respectively.
Effect of pH
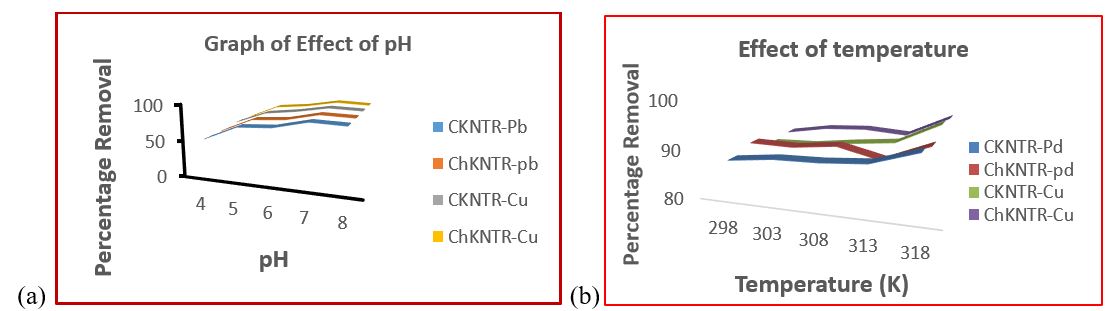
The ionization and chemistry of surface adsorption properties on adsorbent material are mostly influenced by hydronium ion concentration (pH) of the solution by interfering with the charges present on the reactive sites. Figure 3.2a show the graph effect of pH on adsorptive properties of C-KNTR and Ch-KNTR. The surface nature of a C-KNTR and Ch-KNTR studied depends not only on the functional groups but also on the isoelectric point of zero charge (pH PZC, ) (Gümüş, 2019); (Das, Das, Bhowal, & Bhattachariee, 2020). At a lower pH (acidic pH 4), the external surface charges on C-KNTR and Ch-KNTR are highly protonated, these ions compete with Pb2+ and Cu2+ ions for accessible adsorption reactive sites. Thus, low adsorption of Pb2+ and Cu2+ ions on C-KNTR and Ch-KNTR took place at pH4 value. The high C-KNTR and Ch-KNTR adsorption observed was due to more negatively charged present on adsorbent surface as pH value increased from pH4-pH7 thereby increasing the adsorption efficiency of Pb2+ and Cu2+ ions due to decrease in protonation on the adsorbent caused by exchange of hydroxonium ions with hydroxyl ions (Das et al., 2020). The C-KNTR and Ch-KNTR studied adsorption efficiency from the result improved with increase in pH from pH4 until it attains optimum at pH7 with removal percentage of (85.606 % of CKNTR-Pb2+ and 85.507 % of ChKNTR-Pb2+) and (85.886% of CKNTR-Cu2+ and 86.059 % of ChKNTR-Cu2+) respectively. Low adsorption observed at higher pH above pH7 will be attributed to inhibited adsorptive sites on C-KNTR and Ch-KNTR caused by precipitation due to formation of complexes between reactive sites on the adsorbent and Pb2+ and Cu2+ ions.
Effect of Temperature
The result of temperature effect on C-KNTR and Ch-KNTR in figure 3.2 (b) below suggest that adsorption efficiency of both Pb2+ and Cu2+ on C-KNTR and Ch-KNTR was significantly high as temperature increased from 298 to 318 K. The obtained result could be attributed to both increase in kinetic energy of Pb2+ and Cu2+ ions and C-KNTR with Ch-KNTR pore size enlargement which ultimately increases the surface area and efficiency of adsorption sites present on the adsorbent suggesting that Pb2+ and Cu2+ adsorption is an endothermic process. Quantity of Pb2+ and Cu2+ adsorbed on C-KNTR and Ch-KNTR at 318 K maximum temperature studied are (92.7152 % of CKNTR-Pb2+ and 91.519 % of ChKNTR-Pb2+) and (93.702 % of CKNTR-Cu2+ and 93.079 % of ChKNTR-Cu2+) correspondingly.
Effect of Adsorption Dosage
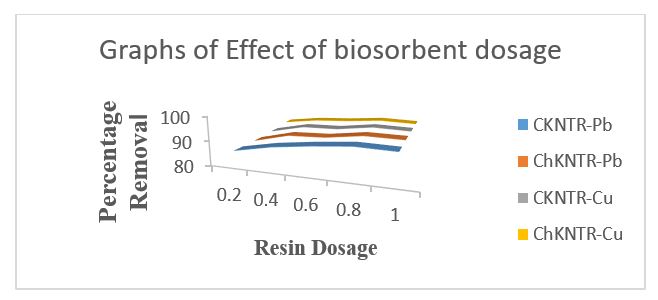
The result from figure 3.3 below show that Pb2+ and Cu2+ adsorption efficiency increased with C-KNTR and Ch-KNTR dosage from 0.2 to 1 g with maximum percentage removal at 1 g as (92.061 % for C-KNTR-Pb2+, 92.154 % for Ch-KNTR-Pb2+) and (92.188 % for C-KNTR-Cu2+, 93.059 % for Ch-KNTR-Cu2+) respectively due to availability of more active sites. However, adsorption capacity reduced from 14.294 to 4.298 mg/g for C-NKTR- Pb2+, 14.113 to 4.114 mg/g for C-NKTR- Cu2+ and 13.394 to 4.291 mg/g for Ch-NKTR-Pb2+, 12.103 to 3.817 mg/g for Ch-NKTR-Cu2+ at 1 g dosage. The decrease in adsorption capacity per unit mass of C-KNTR and Ch-KNTR observed may be due to decrease in total surface area, resulting from overlap or accumulation of adsorption sites in line with (Shen, 2020)report.
Adsorption Isotherm
Langmuir, Freundlich, Temkin, Redlich-peterson and Sips isotherms was studied to understand the fundamental physiological equilibrium relationship between Pb2+ and Cu2+ concentration in liquid phase and that on C-KNTR and Ch-KNTR surface at a specified condition. Error analysis was also studied to understand the goodness of correlation square R2 fit for all the graph plotted. The obtained isothermal parameter and chi-square, root mean square (RME), R Pearson and Marquardt (%) goodness of fit studies of C-KNTR and Ch-KNTR are listed in table 1 below. From the result, Freundlich adsorption isotherm best describe the adsorption isotherm with highest correlation coefficient R2 of (0.9933 for CKNTR-Pb2+, 0.9923 for ChKNTR-Pb2+) and (0.9774 for CKNTR-Cu2+, 0.9894 for ChKNTR-Cu2+) respectively. The Freundlich adsorption intensity (n) was found to be more than 1 in all the adsorbent used which implies that (CKNTR-Pb2+, CKNTR-Cu2+ and ChKNTR-Pb2+, ChKNTR-Cu2+) adsorption was highly favorable. The goodness of fit result of C-KNTR and Ch-KNTR below also show that our calculated values are within probability chart accepted region (Okoli, Diagboya, Anigbogu, Olu-Owolabi, & Adebowale, 2017); (Torrik, Soleimani, & Ravanchi, 2019). From the result below, the R2 were at increasing other from Freundlich > Temkin > Redlich-peterson > Sips > Langmuir which suggests that multi surface adsorption took place during Cu2+ and Pb2+ removal with C-NTR and Ch-NKTR.
|
Isotherms |
Constants |
C-KNTRPb |
C-KNTRCu |
Ch-KNTRPb |
Ch-KNTRCu |
|
Langmuir |
Qmax (mg/g) |
68.144 |
59.09 |
50.247 |
65.186 |
|
Kl (L.mg-1) |
0.609 |
0.291 |
0.238 |
0.177 |
|
|
R1 |
0.843 |
0.396 |
0.712 |
0.445 |
|
|
R2 |
0.818 |
0.734 |
0.6176 |
0.8631 |
|
|
RMSE |
3.876 |
2.318 |
3.4428 |
2.9391 |
|
|
Marquardt (%) |
165.19 |
173.84 |
178.96 |
168.59 |
|
|
R pearson |
0.8914 |
0.881 |
0.8597 |
0.8934 |
|
|
Chi-square |
3.991 |
3.198 |
3.2175 |
3.7903 |
|
|
Freundlich |
Kf |
0.1835 |
0.1099 |
0.1671 |
0.1254 |
|
n |
2.7110 |
4.6458 |
1.6963 |
3.6603 |
|
|
R2 |
0.9933 |
0.9923 |
0.9774 |
0.9998 |
|
|
RMSE |
1.2079 |
1.3837 |
2.3453 |
1.6402 |
|
|
Marquardt (%) |
59.230 |
79.964 |
94.605 |
53.544 |
|
|
R pearson |
0.9971 |
0.9965 |
0.9601 |
0.9957 |
|
|
Chi-Square |
0.9089 |
1.5038 |
2.6712 |
2.3478 |
|
|
Temkin |
A (L/mg) |
0.0963 |
0.0911 |
0.9176 |
0.0901 |
|
B |
0.2107 |
0.2220 |
0.1616 |
0.1623 |
|
|
b (J/mg) |
105.13 |
99.062 |
99.169 |
97.344 |
|
|
R2 |
0.9364 |
0.9213 |
0.9423 |
0.9389 |
|
|
RMSE |
3.7254 |
4.4331 |
3.7484 |
3.9396 |
|
|
Marquardt (%) |
81.054 |
147.75 |
138.22 |
205.29 |
|
|
R pearson |
0.9677 |
0.9598 |
0.9707 |
0.9689 |
|
|
Chi-square |
2.0655 |
3.8091 |
4.3542 |
2.9732 |
|
|
Redlich-Peterson |
A (L/g) |
0.0002 |
0.8916 |
0.0881 |
0.9681 |
|
B (L/mg) |
0.9993 |
0.9993 |
0.9994 |
29.241 |
|
|
β |
0.0001 |
0.6211 |
0.5073 |
0.7606 |
|
|
R2 |
0.9905 |
0.9893 |
0.9723 |
0.9995 |
|
|
RMSE |
1.4371 |
1.6281 |
2.5958 |
0.3501 |
|
|
Marquardt (%) |
64.013 |
127.87 |
42.819 |
28.321 |
|
|
R pearson |
0.9963 |
0.9957 |
0.9889 |
0.9997 |
|
|
Chi-square |
1.2990 |
2.1103 |
2.4029 |
0.1442 |
|
|
Sips |
qs (mg/g) |
89.674 |
152.07 |
81.247 |
80.49 |
|
Ks (L/mg) |
0.0196 |
0.0129 |
1.6175 |
0.0224 |
|
|
ns |
2.0254 |
1.8869 |
1.0165 |
2.3346 |
|
|
R2 |
0.9921 |
0.9938 |
0.9816 |
0.9877 |
|
|
RMSE |
0.4631 |
1.2360 |
0.8041 |
0.7621 |
|
|
Marquardt (%) |
12.757 |
65.432 |
68.985 |
79.553 |
|
|
R pearson |
0.9995 |
0.9970 |
0.9741 |
0.9989 |
|
|
Chi-square |
0.1211 |
0.9200 |
0.6081 |
0.7254 |
Kinetic Modeling of Biosorption
The fits of adsorption data obtained from effect of time in Cu2+ and Pb2+ removal by C-NTR and Ch-NKTR was used to study the kinetics in uptake mechanism using five models; pseudo-first-order, pseudo-second-order, Alovich, Avrami and Weber-Morris also known as intra-particle diffusion. From the data presented in table 3.2 below, pseudo-first-order, Alovich and Avrami depict poor fits in kinetics data as indicated by low correlation value. Pseudo-second-order best fits the kinetic for both Cu2+ and Pb2+ adsorption in all adsorbents due to high values of correlation coefficients (R2) which were closer to unity (0.98-1.00) than those of other models (0.87–0.98) respectively. Also, the goodness of fit result in the table below also show that our calculated values are within probability chart accepted region. Thus, the pseudo-second-order kinetics effectively described the adsorption of Cu2+ and Pb2+ onto the surfaces of both C-NTR and Ch-NKTR, signifying that physisorption is the rate controlling mechanism for adsorption between CKNTR-Pb2+, CKNTR-Cu2+ and ChKNTR-Pb2+, ChKNTR-Cu2+ (Lasheen, Ammar, & Ibrahim, 2012) ; (Yu, Pang, Ai, & Liu, 2016). The Weber-Morris models undoubtedly show the presence of multiple adsorption stages due to high correlation coefficient observed from obtained result ranging from 0.905-0.979 suggesting that pore diffusion was involved in Cu2+ and Pb2+ sorption onto C-NTR and Ch-NKTR.
|
Isotherms |
Constants |
C-KNTRPb |
C-KNTRCu |
Ch-KNTRPb |
Ch-KNTRCu |
|
1st order |
qe (mg/g) |
7.551 |
9.211 |
8.899 |
8.334 |
|
k1 (1/min) |
0.039 |
0.035 |
0.050 |
0.068 |
|
|
R2 |
0.945 |
0.986 |
0.979 |
0.845 |
|
|
RMSE |
0.195 |
0.187 |
0.142 |
0.308 |
|
|
Marquardt (%) |
3.842 |
3.057 |
0.169 |
5.312 |
|
|
R pearson |
0.987 |
0.993 |
0.989 |
0.923 |
|
|
Chi-square |
0.029 |
0.022 |
0.019 |
0.062 |
|
|
2nd order |
qe (mg/g) |
9.386 |
11.749 |
10.478 |
9.335 |
|
k1 (1/min) |
0.004 |
0.003 |
0.006 |
0.011 |
|
|
R2 |
0.985 |
0.991 |
0.990 |
0.998 |
|
|
RMSE |
0.263 |
0.273 |
0.162 |
0.155 |
|
|
Marquardt (%) |
4.991 |
4.531 |
2.482 |
2.706 |
|
|
R pearson |
0.977 |
0.985 |
0.990 |
0.980 |
|
|
Chi-square |
0.051 |
0.048 |
0.016 |
0.016 |
|
|
Elovich |
alpha_e (mg/(g.min)) |
0.659 |
0.610 |
1.794 |
7.377 |
|
beta_e (mg/g)) |
0.446 |
0.331 |
0.488 |
0.724 |
|
|
R2 |
0.925 |
0.949 |
0.953 |
0.988 |
|
|
RMSE |
0.336 |
0.361 |
0.251 |
0.084 |
|
|
Marquardt (%) |
6.608 |
6.251 |
3.977 |
1.416 |
|
|
R pearson |
0.962 |
0.974 |
0.976 |
0.994 |
|
|
Chi-square |
0.085 |
0.087 |
0.039 |
0.004 |
|
|
Avrami |
qe (mg/g) |
7.550 |
9.211 |
8.899 |
8.334 |
|
ka (1/min) |
0.932 |
0.896 |
2.816 |
2.929 |
|
|
na (dimensionless) |
1.184 |
1.482 |
0.017 |
0.023 |
|
|
R2 |
0.985 |
0.986 |
0.978 |
0.945 |
|
|
RMSE |
0.195 |
0.187 |
0.169 |
0.308 |
|
|
Marquardt (%) |
4.705 |
3.744 |
3.747 |
6.506 |
|
|
R pearson |
0.987 |
0.993 |
0.989 |
0.923 |
|
|
Chi-square |
0.288 |
0.022 |
0.019 |
0.062 |
|
|
Weber-Morris |
kwm (mg/g.min^(0.5)) |
0.594 |
0.780 |
0.568 |
0.399 |
|
B (mg/g) |
1.825 |
1.571 |
3.616 |
4.784 |
|
|
R2 |
0.974 |
0.905 |
0.9025 |
0.979 |
|
|
RMSE |
0.437 |
0.489 |
0.363 |
0.112 |
|
|
Marquardt (%) |
9.086 |
8.919 |
6.072 |
1.824 |
|
|
R pearson |
0.935 |
0.951 |
0.950 |
0.989 |
|
|
Chi-square |
0.150 |
0.164 |
0.085 |
0.008 |
Thermodynamic Modeling
Thermodynamic parameters such as standard Gibb’s free energy change (∆ Go ), standard enthalpy change (∆ Ho ), and standard entropy change (∆ So ) was studied for insight in the feasibility of CKNTR-Pb2+, CKNTR-Cu2+ and ChKNTR-Pb2+, ChKNTR-Cu2+ biosorption process and the result from Arrhenius equation above presented in table 3.5 below also show the activation energies of the sorption process. From table 3.2, positive value of ∆Ho> 0 suggest that adsorption was endothermic in nature and also reaffirm that the mechanism of adsorption is physisorption. This reaffirmation indicates that bond between CKNTR-Pb2+, CKNTR-Cu2+ and ChKNTR-Pb2+, ChKNTR-Cu2+ is van der Waals interactions caused by increase degree of freedom at solid liquid interface throughout the adsorption process. The negative value of ∆Go (kJ/mol) in the obtained result increased with temperature suggest that high temperature favors the adsorption process. Hence, spontaneity of all the studied adsorption process. Positive ∆S o (kJ/mol) in table 3.5 suggest that the degree of freedom (randomness) increased at the solid-liquid interface during CKNTR-Pb2+, CKNTR-Cu2+ and ChKNTR-Pb2+, ChKNTR-Cu2+ and reversible adsorption process. The activation energy (Ea) can give an idea about the rate and type of adsorption. Physisorption usually have activation energies (Ea) in the range of 5 to 40 kJ/mol, while higher activation energies (Ea) of 40 to 800 kJ/mol suggest chemisorption. The positive value of obtained result in table 3.5 show that the activation energies (Ea) was less than 40 kJ/mol which further reaffirm that physisorption is the mechanism of CKNTR-Pb2+, CKNTR-Cu2+ and ChKNTR-Pb2+, ChKNTR-Cu2+ adsorption process.
|
Isotherms |
Temp. (K) |
C-KNTRPb |
C-KNTRCu |
Ch-KNTRPb |
Ch-KNTRCu |
|
Thermodynamic parameters |
∆Go(kJ/mol) |
∆Go(kJ/mol) |
∆Go(kJ/mol) |
∆Go(kJ/mol) |
|
|
298 |
-7.650870324 |
-7.621838342 |
-7.686995361 |
-7.63397635 |
|
|
303 |
-7.810797834 |
-7.758578218 |
-7.812331643 |
-7.807983424 |
|
|
308 |
-7.946979237 |
-7.921685021 |
-7.971484259 |
-7.952933571 |
|
|
313 |
-8.09789914 |
-8.082531487 |
-8.125954558 |
-8.151693393 |
|
|
318 |
-8.314176184 |
-8.342180126 |
-8.279827382 |
-8.324534831 |
|
|
∆Ho(kJ/mol) |
1.95620328 |
2.881806527 |
1.254107443 |
2.645613451 |
|
|
∆So(kJ/mol) |
32.19322178 |
35.13599378 |
29.95107335 |
34.46319994 |
|
|
Ea(kJ/mol) |
21.19322178 |
24.13599378 |
23.95107335 |
26.46319994 |
|
|
R2 |
0.942154647 |
0.917540261 |
0.921504964 |
0.970164778 |
|
|
RMSE |
2.8 x 10⁵ |
7.4 x 10⁵ |
5.3 x 10⁵ |
4.1 x 10⁵ |
|
|
Marquardt (%) |
0.007593705 |
0.012207123 |
0.003281909 |
0.172886528 |
|
|
R pearson |
0.917689843 |
0.90417933 |
0.959950501 |
0.98496943 |
|
|
Chi-square |
9.2 x 10⁵ |
2.3 x 10³ |
1.7 x 10⁵ |
2.7 x 10⁵ |
Desorption studies
Desorption of CKNTR-Pb2+, CKNTR-Cu2+ and ChKNTR-Pb2+, ChKNTR-Cu2+ efficiencies was generally low (< 55%), natural water (H2O) was obtained to have the best overall desorption efficiency. Desorption efficiency follows the order H2O > HCl > CH3COOH for the CKNTR-Pb2+, CKNTR-Cu2+ and ChKNTR-Pb2+, ChKNTR-Cu2+ system. The highest desorption efficiency obtained for H2O, HCl and CH3COOH are in table 3.6 below. The obtained result further affirms that uptake of CKNTR-Pb2+, CKNTR-Cu2+ and ChKNTR-Pb2+, ChKNTR-Cu2+ is via physisorption. Low percentage desorption on C-NTR and Ch-NKTR surface may be attributed to a possibility of large net adsorption energy because of multiple contact points between Cu2+ and Pb2+ molecules and adsorbents (Li, 2019).
|
Desorption |
Chemicals |
C-KNTRPb |
C-KNTRCu |
Ch-KNTRPb |
Ch-KNTRCu |
|
Desorption (%) |
H 2 O |
51.83 |
39.11 |
40.02 |
25.91 |
|
HCl |
3.01 |
0.43 |
3.81 |
0.17 |
|
|
CH3COOH |
4.96 |
2.81 |
4.17 |
1.11 |
Conclusion
In the present work, the kinetics and thermodynamics of chemically modified kola nut testas was studied as a possible adsorbent for removal of Cu2+ and Pb2+ ion in aqueous solution using batch adsorption techniques. The percentage removal of heavy metals was found to decreased with an increase in the initial heavy metal concentration from 10-50 mg/L while it increased with increase in contact time. Highest Optimum adsorption was found at pH 7, temperature 45 °C, dosage 0.2 g, concentration 10 mg/L and contact time of 60 minutes with percentage adsorption (89.982 % for C-KNTR-Pb, 90.909 % for Ch-KNTR-Pb) and (86.782 % for C-KNTR-Cu and 83.973 % for Ch-KNTR-Cu). Among the parameter isotherm models examined, the Freundlich isotherm model best describe the adsorption of CKNTR-Pb2+, CKNTR-Cu2+ and ChKNTR-Pb2+, ChKNTR-Cu2+ with high correlation coefficients (R2) which were closer to unity (0.98-1.00) suggesting that adsorption followed multi sites. The modified adsorption kinetic studies satisfactorily described that the experimental data results obtained followed the second-order kinetic reaction. Alovich, Avrami and Weber-Morris models suggests that multiple mechanism was involved in the CKNTR-Pb2+, CKNTR-Cu2+ and ChKNTR-Pb2+, ChKNTR-Cu2+ adsorption process. Negative values for ∆Go , and positive value of ∆Ho , and Ea indicated that adsorption occurs in a spontaneous and endothermic manner, while the negative value of ∆S ◦ indicated increase disorderliness at the solid-liquid interface during adsorption. In addition, values of the standard enthalpy change (∆Ho ) and activation energy (Ea ) also suggest that the adsorption of CKNTR-Pb2+, CKNTR-Cu2+ and ChKNTR-Pb2+, ChKNTR-Cu2+ were physisorption process.
Conflict of Interest
The author declares no conflict of interest