Effect of different nitrogen concentration on the growth, proximate and biochemical composition of freshwater microalgae Monoraphidium contortum
Abstract
The objective of this study was to examine the effect of different nitrogen concentrations on the growth, pigments and proximate composition of freshwater microalgae Monoraphidium contortum. It was observed that higher nitrogen concentration had significant (p<0.05) impact on enhancing microalgal growth, photosynthetic activity, protein and carbohydrate content. Maximum cell density (7.19×10⁷ cells/ml), dry biomass (0.61g/L), total chlorophyll (17.42 mg/L) were obtained in the highest concentration of (18.5g/500 mL) NaNO3; on the contrary, minimum values were found in 6.5g/500 mL NaNO3. Carotenoid (6.14 mg/L) and total phycobiliprotein (4.11 mg/g) were maximum in control concentration (12.5g/500mL) of NaNO3. Proximate composition also varied significantly (p<0.05) among all the treatments, where maximum protein (23.77% dry weight) and carbohydrate (22.79% dry weight) were produced in the highest nitrogen concentration (18.5g/500mL NaNO3) and minimum protein (16.36% dry weight) and carbohydrate (14.08% dry weight) were found in the lowest nitrogen concentration (6.5g/500mL NaNO3). Moreover, the highest lipid accumulation (20.07% dry weight) was obtained at the concentration of 6.5g/500mL NaNO3, whereas the lowest 15.88% dry weight lipid was in 12.5g/500mL NaNO3. This study stated that higher nitrogen concentration boosts the growth and nutritional profile of M. contortum, but lower nitrogen concentration enriches the lipid production which will be economic in commercial microalgae culture.
Keywords
Monoraphidium contortum, Nitrogen stress, Growth curve, Pigments, Proximate composition 30 31
Introduction
Since microalgae gained prominence as a green energy source for biofuel in the next generation, global demand for it has been steadily expanding. A variety of microalgae species are being cultured in hatcheries for different purposes, including human nutrition, aquaculture nutrition, biofuel production, pharmaceutical and cosmetics manufacturing, and biofertilizer production (Chisti, 2008); (Wijesekara, Pangestuti, & Kim, 2010); (Leckie, 2021). Microalgae are often used as live feed in the aquaculture food chain at various phases of crustacean, bivalve mollusc, certain fish species, and zooplankton growth (Brow, 2002); (Mishra & Pabbi, 2004). They generate vitamins, which increases their value as a source of nutrition for humans and animals (Cuellar-Bermudez, 2015); (Qu, 2019). They also produce a variety of polysaccharides that are useful in medicine. Chlorophyll, β-carotene and other carotenoids, phycobiliproteins, and astaxanthin are all beneficial and commercially relevant pigments produced by various species. These pigments are important in cancer, neurological disorders, and optical illnesses treatments (Guil-Guerrero, Navarro-Juarez, Lopez-Martinez, Campra-Madrid, & Rebolloso-Fuentes, 2004); (Soletto, Binaghi, Lodi, Carvalho, & Converti, 2005).
Monoraphidium sp. is a prospective source of eicosatetraenoic acid and α-Linolenic acid which play a crucial role in anti-inflammatory and antioxidant responses in mammalian cells. The high content of ω-3 PUFAs qualifies it as a source of human health nutrition supplements in terms of growth and lipid accumulation (Yu, 2012); (Lin, 2019). Stress circumstances, such as nutritional scarcity and other external causes, can initiate strategies for lipid and carotenoids accumulation (Dhup & Dhawan, 2014). On nitrogen deprivation in BG-11 medium, Singh, Paliwal, Nesamma, Narula, and Jutur (2020) demonstrated larger amounts of lipid and antioxidant compounds accumulation such as α- and δ-tocopherols in Monoraphidium sp. Since having potential profile of astaxanthin this microalga was also used as functional aquafeed for prawn in order to enhance body pigment (Fujii, 2010). Bold Basal Media is comparatively enhanced culture media as better growth performance and biochemical composition of Scenedesmus obliquus was found in Bold Basal Media than Bristol and 2.5% waste water media (Chisti, 2008; Khatoon, Rahman, Suleiman, Banerjee, & Munafi, 2017; Khatoon, Yuan, Mahmud, & Rahman, 2020). It has also been reported that sodium nitrate has significant impact on the high specific growth rate of microalgae than urea, ammonium carbonate and ammonium chloride (Podevin, De-Francisci, Holdt, & Angelidaki, 2015).
The economic viability of biodiesel and highly value added bioproducts produced from microalgae, as well as biomass productivity and lipid yields are important parameters that must be optimized. Modification of culture techniques such as changing the nutritional elements of the growth medium, microalgae development phases, and ambient conditions can increase biomass yield and biomolecules composition, particularly fatty acid production in microalgae. Recently much work has been done on different microalgae species to enhance its growth performance, lipid production and enrich the nutrient composition. When a light source and CO2 are available, nutrient limitation is one of the most effective triggers for increasing lipid accumulation in a single microalgal cell (Li, Han, Sommerfeld, & Hu, 2011). Nitrogen is a critical macronutrient that impacts the metabolism as well as biochemical composition and growth of microalgae, as a component of biological macromolecules such as proteins, DNA, and chlorophylls. In microalgae, adding or limiting nitrogen concentration has significant impact on the growth rate, as well as protein, lipid, and carbohydrate synthesis. Photosynthetic activity and biochemical composition such as fatty acids, pigment, and protein are notably affected by nitrogen limitation; which is also effective to boost the lipid content in microalgae. Nitrogen constraints also influence in conversion of free fatty acids into triacylglycerols (TAGs) over the time, which is suitable microalgal lipid feed--stock for biodiesel production (Nayak, Suh, Chang, & Lee, 2019). Daily addition of some amount of NaNO3 to the microalgae culture medium improved algal growth, biochemical characteristics, and lipid synthesis (Zhang & Liu, 2016); (Nayak et al., 2019). Furthermore, Zarrinmehr (2020) noticed that at sufficient nitrogen concentrations (72 mg/L), polyunsaturated fatty acids (PUFAs) increased five-fold, compared to nitrogen deprivation, where saturated fatty acids (SFAs) concentrations were higher than nitrogen sufficiency.
Therefore, to improve the growth, nutritional and biochemical composition, it is necessary to standardize the distribution of nutrients, particularly nitrogen for microalgae cultivation. Despite many studies on other species of Monoraphidium sp., no research has been done on the effect of different nitrogen concentrations on the growth and biochemical composition of M. contortum in Bold Basal Media. This research aims to explore the certain nitrogen concentration which will enhance the growth, productivity, pigment, and proximate composition of freshwater M. contortum regarding culture period and controlled culture condition. These research findings will help to improve the nutritional properties of M. contortum, so it will be an integral part of aquaculture nutrition as a live feed and also for high-quality fish feed formulation.
Materials and Methods
Microalgae collection and culture
The freshwater Monoraphidium contortum was cultured in slight modified Bold Basal Media (Stein, 1980) under controlled environment at 25.2 ± 0.7°C, 7.72 ± 0.17 pH, 4.53 ± 0.53 mg/L dissolved oxygen and 150 E m-2s-1 light intensity for 24 hours. This experiment was conducted in the laboratory of Live Feed Research Corner, CVASU from where pure Monoraphidium contortum stock was collected.
Experimental Design
There were five treatments of different nitrogen (NaNO3) concentration as 6.5g/500mL (T1), 9.5g/500mL (T2), 12.5g/500mL (control), 15.5g/500mL (T3), and 18.5g/500mL (T4) according to 24% up and down from control. This experiment was divided into two parts: firstly, analysis of growth curves and secondly, analysis of biomass productivity, pigment and proximate composition. To analyze the growth curve, 2% M. contortum seeds (~ 105 cells/mL) from pure stock were inoculated in 300 ml culture media of each treatment within a 500 ml conical flask. Growth parameters such as cell density and optical density were measured every day to explore the stationary phase up to 13 days of the culture period. Afterward, mass culture was continued in a 2 L volume Erlenmeyer flask along with 2% M. contortum seed inoculation till stationary phase for each treatment. Then the harvested microalgae through a centrifuge (Hitachi* High-speed Refrigerated Centrifuge, himac CR 21g-II) was dried at 40 °C and then preserved into the refrigerator for subsequent biomass productivity, pigments and proximate analysis.
Determination of Growth Curve
Determination of Cell Density
Microalgal cells were counted every day with a hemacytometer throughout the growth curve experiment according to Lavens and Sorgeloos (1996).
Determination of Optical Density
Daily absorbance change at 428 nm wavelengths was measured using a NanoDrop Spectrophotometer (NanoPlus, WAVE ANALYTICS D-82362 Weilheim, Germany) where treatment wise culture media was used as the blanks.
Determination of Biomass
Biomass was estimated through slight modification of procedure described by Ratha (2016). After rinsing with 10 ml distilled water and drying for 4 hours at 100°C in a Hot Air Oven (LNO- 150, LABNICS Equipment, USA) followed by 15-20 minutes desiccation, filter papers (47 mm Whatman® GF/C) were weighed. Vacuum filtration was used to filter 1 ml microalgae sample from each culture through pre-weighed filter paper. The filter paper with biomass was then rinsed three times with 10 ml distilled water before being oven-dried for another four hours at 100°C, followed by 15-20 minutes of desiccation. Weighing filter paper with biomass was also done. The dry biomass concentration was then estimated by dividing the difference between the pre and post-filtration weights of the dried filter paper by the filtered volume.
Specific Growth Rate and Cell Doubling Time Estimation
The Specific Growth Rate, μ (day-1) and cell doubling time of cultured microalgae was calculated according to Xu, Ibrahim, and Harvey (2016).
SGR, μ (day-1) = ln (C2 -C1)/( t2 -t1)
Where,
C2 -C1 = Difference in Cells/ml between the end and beginning of the experiment; t2 -t1 = Time interval between final and initial days
From the above equation, the cell doubling time of the culture was calculated as days required for duplication using the following formula:
td (day) = 0.693/SGR
Productivity Estimation
For each treatment, volumetric (Green, Lundquist, & Oswald, 1995), areal (Ugwu, Aoyagi, & Uchiyama, 2008), and lipid (Benemann & Tillett, 1987) productivity were estimated using dry biomass and percentage of lipid at the stationary phase of microalgae cultures.
Volumetric productivity, VP (g L -1 day -1) = (Xn – X0)/ N
Where, Xn = Final biomass (g/L), X0 = Initial Biomass (g/L) and N = Culture days
Areal productivity, AP (g cm-2day-1) = (VP x V)/A
Where, VP = Volumetric Productivity (g L -1 day -1), V = Total volume of the culture (L),
A = surface area occupied ground (cm2).
Lipid productivity, LP (mg L-1 day-1) = VP x (% lipid/100)
Where, VP = Volumetric productivity of the culture, % lipid = Percentage of lipid content as dry weight basis.
Determination of Pigments
Extraction of Microalgae for Chlorophyll Determination
Microalgae sample was extracted according to (Jenkins, 1982) with few modifications for chlorophyll determination. 1mL of microalgae sample from the culture had been transferred to the filter (47 mm Ø Whatman® GF/C glass microfiber filter papers) after 1mL of 1% MgCO3 vacuum filtration. Then the filter paper was submerged into 5mL of 90% acetone for 2 minutes and then ground for 1 minute by a tissue homogenizer. After recurring this procedure twice, centrifuge tubes were refrigerated (4°C) for 1 hour in the dark. Thereafter the acetone extracts were centrifuged at 2000 to 3000 rpm for 10 minutes. Further, the clear supernatant was centrifuged at a low speed (300-500 rpm) for 5 minutes. Determination of Chlorophylla, b (Dichromatic method
The clean extract was measured absorbance at 750, 664, 647, and 630 nm wavelengths, where OD at 750nm was used as a turbidity correction factor and subtracted from the other wavelengths’ absorbance. The concentrations of chlorophyll a and b in the acetone extract were calculated by the following equations (Jeffrey & Humphrey, 1975):
Ca(mg/L) = 11.85(OD664) - 1.54(OD647) - 0.08(OD630)
Cb (mg/L) = 21.03(OD647) - 5.43(OD664) - 2.66(OD630)
After that, the amount of pigment per unit volume was calculated as follows:
Chlorophyll a, mg/m³ = (Ca × extract volume, L)/ volume of sample, m³
Determination of Carotenoids
At the stationary phase of each culture 1ml algal suspension was extracted and carotenoid amount was calculated following Khatoon, Yuan, Mahmud, & Rahm An, Gao, Zhao, Chen, and Li (2020).
Extraction of Phycobiliproteins
M. contortum powder (40 mg) was soaked in 10 ml phosphate buffer solution (pH 7.0; 0.1M), vortex mixed thoroughly, and stored at 4°C for 24 hours. After centrifuging at 6000 rpm for 10 minutes, the supernatant was collected and absorbance was measured using a NanoDrop Spectrophotometer (NanoPlus, WAVE ANALYTICS D-82362 Weilheim, Germany) at wavelengths of 562, 615, and 652nm, with phosphate buffer as a blank (Siegelman & Kycia, 1978).
Spectrophotometric Estimation of Phycobiliproteins
Spectrophotometric Estimation of Phycobiliproteins
The amount of phycocyanin, phycoerythrin, and allophycocyanin in the sample was determined using the extinction coefficients and the following formulae (Siegelman & Kycia, 1978):
Phycocyanin (mg/mL) ={A615-(0.474×A652)}/5.34
Allophycocyanin (mg/mL) ={A652-(0.208×A615)}/5.09
Phycoerythrin (mg/mL) ={A562-(2.41×PC)-(0.849×APC)}/9.62
The following formulas were used to compute total phycocyanin, phycoerythrin, and allophycocyanin (mg/g) (Silveira, Burkert, Costa, Burkert, & Kalil, 2007):
Phycobiliprotein (mg/g) = (Pigment concentration V) / DB
Here, V= solvent volume, DB= Dried biomass
The sum of the phycocyanin, phycoerythrin, and allophycocyanin contents in dried microalgae biomass was used to compute total phycobiliproteins (mg/g).
Determination of Proximate Compositions
Protein and carbohydrate were determined by spectrophotometric method according to L Lowry, Rosebrough, Farr, and Randall (1951) and D Dubois, Gilles, Hamilton, Rebers, and Smith (1956) respectively. Lipid was determined according to Bligh and Dyer (1959).
Statistical Analysis
MS Excel was used to determine the mean of three replications' values, standard deviation and standard error. IBM SPSS (v. 26.0) was used for statistical analysis. Significant difference between the treatments in terms of growth parameters, productivity, pigments, and proximate composition was evaluated with One Way ANOVA. Duncan test was applied to determine the homogenous subsets (alpha = 0.05).
Result and Discussion
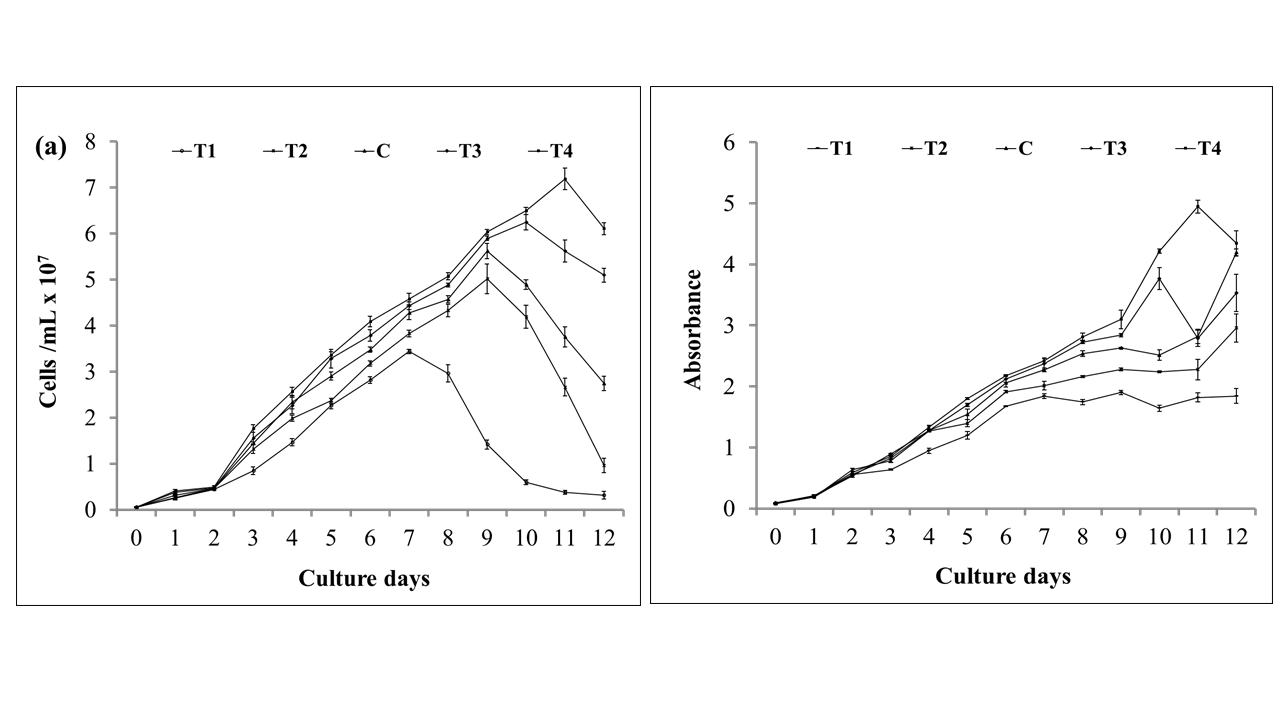
Microalgal growth and biochemical properties had been significantly changed due to different NaNO3 concentrations in the culture media. A regular change in cell density and optical density of M. contortum over the culture period for different nitrogenous treatments has been shown clearly in Figure 1 (a, b) which varied significantly from day-1 to day-12. Initial cell density was ≈5.1*105 cells/mL in day-0 which was lag phase and there were no significant difference in day-0 (p>0.05). Afterwards the cell growth turned into exponential phase from day-1 and varied significantly (p < 0.05) among the treatments. In case of five treatments such as 6.5g/500mL NaNO3 (T1), 9.5g/500mL NaNO3 (T2), 12.5g/500mL (control), 15.5g/500mL NaNO3 (T3), and 18.5g/500mL NaNO3 (T4), stationary phases were found on day-7, 9, 9, 10, 11 respectively according to the cell density and optical density. Highest cell density was 7.19×10⁷ cells/mL at T4 on day-11 and lowest cell density was 3.44×10⁷ cells/mL at T1 on day-7 among all other treatments. Although having same day of stationary phase for T2 and C, cell density was different. However, T2, C and T3 resulted significantly (p< 0.05) higher cell density in a respective way such as 5.02 × 10⁷, 5.62 × 10⁷ and 6.25 × 10⁷ cells/mL. Also maximum optical density 4.95 ± 0.10 absorbance was observed in highest nitrogen concentration 18.5g/500mL NaNO3 and minimum optical density 1.84 ± 0.03 absorbance was in the lowest nitrogenous treatment 6.5g/500mL NaNO3 at their stationary phases on day-7 and day-11. Among these growth parameters, there have highly significant correlation (R2 = 0.95; p < 0.05) between cell density and optical density. Similar to this result, Zarrinmehr (2020) reported that minimum and maximum cell concentration of Isochrysis galbana were achieved in 36 and 144 mg/L NaNO3 respectively in Walne’s medium. Scenedesmus obliquus growth was promoted by daily addition of 2 mg N L-1 of CH4N2O in M-11 culture medium yielded the highest cell density 1.7×10⁷ cells mL-1 after 20th day of culture period (An et al., 2020). It can be justified as higher nitrogen concentration promotes the algal biomass production, but lower nitrogen concentration has remarkable effect on retarding microalgae growth (Li, Wan, Li, & Zhang, 2013); (Zarrinmehr, 2020).
Microalgal biomass productivity also significantly (p< 0.05) changed according to gradient of nitrogen concentrations (Table 1). Dry biomass and volumetric productivity decreased from 18.5g/500ml NaNO3 to 6.5g/500ml NaNO3 treatments with decreasing nitrogenous treatments. The findings of the current result was supported by Z Zhu, Huang, Xu, Wang, and Yuan (2014) who demonstrated that maximum biomass productivity was obtained in higher nitrogen concentration. Yang (2008) reported that biomass growth in Chlamydomonas reinhardtii was subdued under nitrogen deficiency up to 31.7%. Nitrogen limited conditions of microalgae culture has led to a significant decrease in the cell density as well as biomass productivity.
But lipid productivity was highest 7.84±0.65 mgL-1day-1 in maximum nitrogen concentration 18.5g/500mL NaNO3 whether lowest 5.54±0.53 mgL-1day-1 was in 9.5g/500mL NaNO3. Increment of nitrogen concentration18.5g/500mL NaNO3 from the control treatment 12.5g/500mL NaNO3 became more stressful than the lowest nitrogenous treatment which enhanced the lipid productivity. Nitrogen stress has positive response in case of lipid production, as change in standard nitrogen concentration may cause hectic culture environment and also cause increment in lipid production rate. Compared to adequate nitrogenous medium, two fold lipid was produced in nitrogen deficient culture conditions (Pruvost, Vooren, Gouic, Couzinet-Mossion, & Legrand, 2011); (Jia, 2015).
Specific growth rate increased gradually with the decreasing nitrogen concentration; on the contrary, cell doubling time was reduced in lower nitrogen concentration and increased with the higher nitrogen concentration. Maximum specific growth rate value (0.58 ± 0.02 day-1) was obtained in the least nitrogen concentration, T1 (6.5g/500mL NaNO3) and minimum value (0.45 ± 0.01 day-1) was obtained in the highest nitrogen concentration, T4 (18.5g/500mL NaNO3). Besides significant (p< 0.05) highest cell doubling time was 1.55 ± 0.04 day in T4 and lowest was 1.19 ± 0.04 day in T1. Table 1 exhibits positive relation between specific growth rate and cell doubling time as lower cell doubling time aided in higher specific growth rate. Like the present result, Saha (2013); K Kendırlıoglu, Agırman, and Cetın (2015) stated to that cell growth rate was greater in cultures subjected to lower nitrogen concentration.
|
Parameters |
T1 |
T2 |
C |
T3 |
T4 |
|
Dry biomass (g/L) |
0.32±0.03a |
0.37±0.02b |
0.45±0.02c |
0.53±0.04d |
0.61±0.02e |
|
Volumetric Productivity (gL -1 day -1 ) |
0.029± 0.001 a |
0.031± 0.001 a |
0.038± 0.003 b |
0.04±0.01 b |
0.045±0.005 b |
|
Areal Productivity (mgcm -2 day -1 ) |
0.0029± 0.0001 a |
0.0031± 0.0001 a |
0.0038± 0.0003 b |
0.004± 0.0007 b |
0.0045± 0.0005 b |
|
Lipid Productivity (mgL -1 day -1 ) |
5.94±0.28 a |
5.54±0.53 a |
6.13±0.45 a |
6.72±1.01 ab |
7.84±0.65 b |
|
Specific Growth Rate, μ (day -1 ) |
0.58±0.02 d |
0.51± 0.03 bc |
0.53±0.01 c |
0.48±0.01 b |
0.45±0.01 a |
|
Cell doubling time, td (day) |
1.19±0.04 a |
1.36± 0.08 bc |
1.32±0.03 b |
1.44±0.03 c |
1.55±0.04 d |
|
|
|
|
|
|
|
A gradual rise was observed in biomass production and chlorophyll production from the lower nitrogenous treatment to the higher nitrogenous treatment due to continuous increment of cell density. Significant change in chlorophyll a and b has also been shown in Figure 2 according to the treatments; moreover, values of chlorophyll a and b have significant strong correlation (R2 = 0.97; p<0.05) between them. Chlorophyll a value were amplified successively 3.35 ± 0.11 to 14.96 ± 0.85 mg/L and chlorophyll b values were 0.98 ± 0.07 to 2.47 ±0.14 mg/L from minimum to maximum nitrogenous treatment at their stationary phase. Zarrinmehr (2020) also illustrated that chlorophyll a and chlorophyll b reduced with diminishing nitrogen concentration from 144 to 0 mg/L. Zhang and Liu [2016] observed that total chlorophyll content in I. galbana decreased from 5.9 to 3.9 mg/L under nitrogen deprivation compared to control culture condition. Nitrogen starvation lessens efficiency of photo system II activity and hampers the photosynthetic pigment synthesis as a restriction factor (Zhang & Liu, 2016); (Xie, Xia, Zeng, Li, & Zhang, 2017). Nitrogen deficiency has negative effect on cellular growth of microalgae along with chlorophyll synthesis (Yang, 2008).
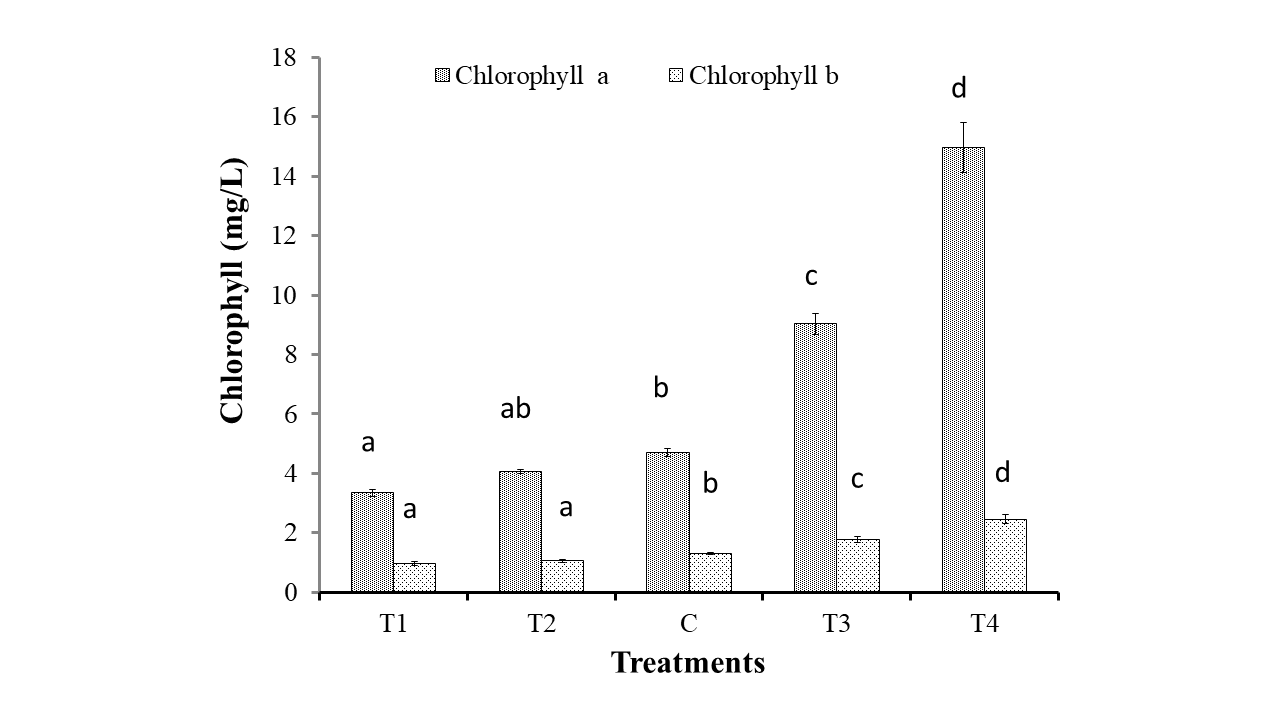
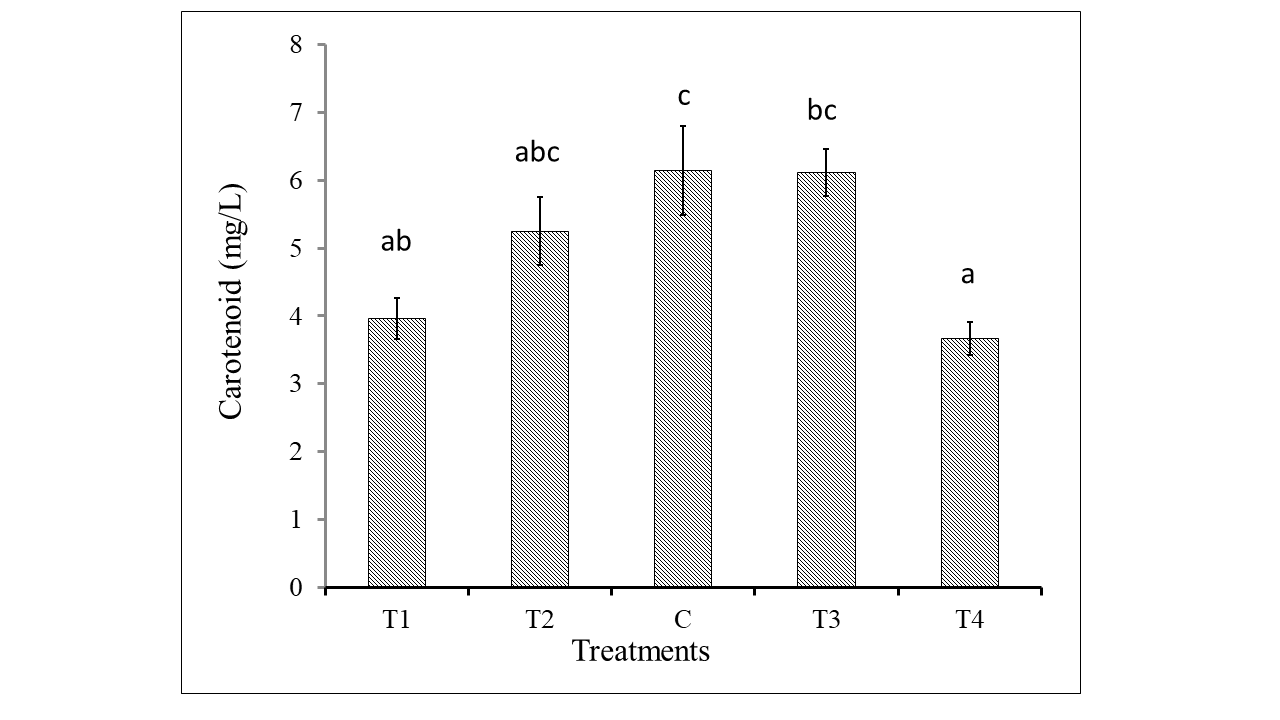
Figure 3 shows the highest amount of carotenoid (6.14 ± 0.65 mg/L) was produced under control treatment and then 6.11 ± 0.34 mg/L carotenoid was produced under T3. The lowest carotenoid content was obtained 3.67 ± 0.24 mg/L under T4. 3.96 ± 0.29 mg/L carotenoid was produced under the least nitrogen concentration 6.5g/500mL NaNO3 which is considerably higher amount as nitrogen limitation influences carotenoid production in the cell (Juneja, Ceballos, & Murthy, 2013). Similar to this result, Zarrinmehr (2020) also found that the minimum 1 mg/L and maximum 1.21 mg/L total carotenoid content were achieved in 36 and 72 mg/L nitrogen. Change in nitrogen concentration from standard concentration of Bold Basal Media may cause stress on cell metabolism which interferes on carotenoid accumulation (Juneja et al., 2013).
Nitrogen is also an essential nutrient for phycobiliproteins production. The mean value of phycobiliprotein, phycocyanin, phycoerythrin and alophycocyanin of all the treatments are presented in Table 2. Total phycobiliprotein was highest in amount 4.11 ± 0.07 mg/g under control treatment (12.5g/500mL NaNO3) and the lowest in amount 1.45 ± 0.26 mg/g under T2. Significantly higher amount of phycobiliprotein, 2.27 ± 0.38 mg/g was produced in T4 after C. Nitrogen deficiency reduced the formation of photosynthetic pigments like chlorophyll and phycobiliproteins, resulting in a decrease in photosynthetic performance (Zhao, 2017). In C (12.5g/500mL NaNO3), phycocyanin, alophycocyanin and phycoerythrin were in the highest amount such as 1.05 ± 0.07, 2.25 ± 0.01 and 0.81 ± 0.02 mg/g. Shifting nitrogen concentration from standard concentration interferes in enzymatic activity of pigment production and photosynthesis (Juneja et al., 2013). As phycobiliprotein is an accessory pigment for light harvesting in photosynthesis, lower chlorophyll production and photosynthetic activity tends to increase in phycobiliprotein in standard nitrogen concentration. Furthermore, this study found that nitrogen stress has no positive impact on phycobiliprotein synthesis.
|
Treatments |
Phycocyanin ( mg/g) |
Alophycocyanin ( mg/g) |
Phycoerythrin ( mg/g) |
Total Phycobiliprotein ( mg/g) |
|
T1 |
0.478 ±0.034b |
1.091 ±0.055ab |
0.408 ± 0.023b |
1.977±0.113ab |
|
T2 |
0.228±0.054a |
0.991±0.145a |
0.232±0.066a |
1.451±0.264a |
|
C |
1.051±0.066c |
2.249±0.014 c |
0.811±0.021c |
4.113±0.073c |
|
T3 |
0.296±0.019ab |
0.931±0.089a |
0.272±0.006a |
1.5±0.115a |
|
T4 |
0.473± 0.122b |
1.336 ± 0.193b |
0.465 ±0.063b |
2.274 ±0.377b |
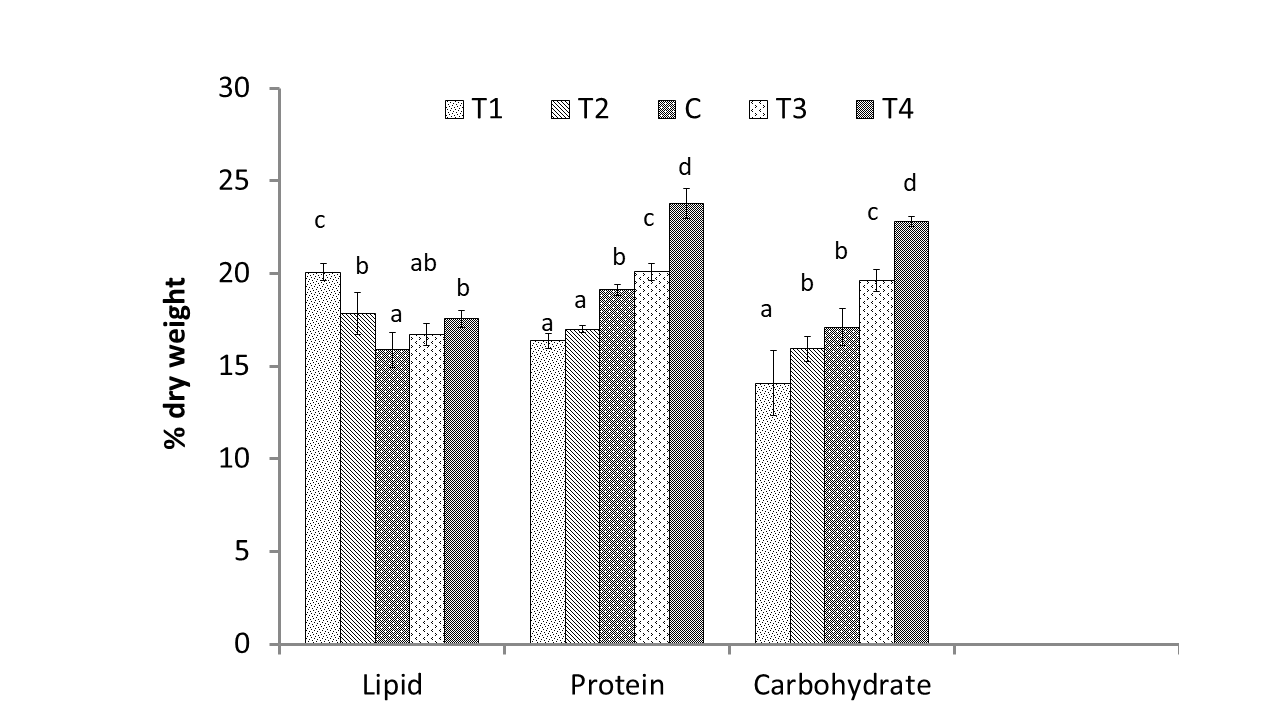
Figure 4 interprets the effect of gradient concentration of nitrogen on the protein, lipid and carbohydrate content of freshwater microalgae M contortum. The highest protein and carbohydrate content (23.77 ± 0.81 and 22.79 ± 0.26 % dry weight, respectively) were produced under T4, as well as the highest lipid content (20.07 ± 0.46 % dry weight) was obtained under T1. There has highly significant difference in protein, lipid and carbohydrate of M. contortum according to nitrogen stress (p < 0.05). Gradual increment of protein percentage was found from lower nitrogenous treatment to higher nitrogenous treatment such as minimum 16.36 ± 0.41 % dry weight protein was produced under T1. Lipid percentage was significantly higher in nitrogen stress treatments such as T1 (20.07 ± 0.0.46 % dry weight), T2 (17.84 ± 1.15 % dry weight), T4 (17.55 ± 0.45 % dry weight) and T3 (16.71 ± 0.62% dry weight) than control treatment (15.88 ± 0.95 % dry weight).
Protein percentage increased gradually according to addition of nitrogen concentration as nitrogen is a major component for the biosynthesis of nitrogenous organic compounds like protein, chlorophyll and nucleic acids (Saha, Uma, & Subramanian, 2003); (Simionato, 2013). M Menegol, Diprat, Rodrigues, and Rech (2017) attained 45% higher protein content (138 mg g-1) in Heterochlorella luteoviridis cultivated with nitrogen concentration 60 mgL-1 N-NO3 nitrogen concentration than 12 mg L-1 N-NO3nitrogen concentration. Jia (2015) reported similar to the present study that two fold lipid was produced by nitrogen deficient culture condition than nitrogen sufficient medium. As storage products lipid and carbohydrate accumulation in microalgae is caused by nitrogen starvation, which is also accompanied by degradation of cellular nitrogenous substances, such as nucleic acid, proteins, and photosynthetic pigments (Pruvost et al., 2011). Due to lack of sufficient nitrogen concentration in microalgae culture, most of the carbon fixed in photosynthesis is used in the lipid synthesis instead of protein. This change in lipid metabolic pathway influences the accumulation of neutral lipid including triacylglycerides (TAGs) as a source of carbon and energy in the cytoplasm of microalgal cell (Yang, 2008); (Li, Fei, & Deng, 2012); (Chu, 2013).
The highest 22.79 ± 0.26 % dry weight carbohydrate was produced under T4 and The minimum percentage of carbohydrate 14.08 ± 1.75 % dry weight in T1, 6.5g/500mL NaNO3. More carbohydrate was produced under cultivation with higher nitrogen concentration and gradual decrease was found in lower nitrogen concentration. A previous study also found equivalent outcome with this present study that is lower carbohydrate yield (18.75 ± 0.59%) was obtained after 14 days at nitrogen stress condition, compared to the control (22.04 ± 0.61%). The early stages of the nitrogen stress promoted carbohydrate buildup, but this began to decrease on day 4 when the carbon transitioned to lipid formation (Nadzir, Yusof, Nordin, Kamari, & Yusoff, 2021). L Li et al. (2011) stated that, after 2 days of nitrogen stress condition, the photosynthetically assimilated carbon flux of Pseudochlorococcum sp. was turned into fatty acid and neutral lipid synthesis in lieu of carbohydrate synthesis.
Conclusions
The response of M. contortum under different nitrogen concentration revealed that higher nitrogen concentration had greater impact on increment of biomass productivity, photosynthetic chlorophyll concentration, protein, carbohydrate percentage. Although lower nitrogen concentration had significant effect on enhancing lipid percentage as well as trivial increment of carotenoid and phycobilliprotein content. The results of this study will be helpful to boost the production and improve the nutraceutical as well as pharmaceutical attributes of the freshwater microalgae M. contortum through mass cultivation with appropriate nitrogen concentration. Based on the findings, it is possible to improve the nutritional profile of the fish diet formulated by M. contortum and explore the antimicrobial properties to develop drug. Thus it can be concluded that this result will enrich the potentiality of aquaculture industry, biofuel production worldwide and pave the way for future research as well.
Author Contributions
Fardous Ara Mukta– Conducting the experiment, data collection and curation, statistical analysis, and manuscript draft; Helena Khatoon – Conceptualization, supervision, critical review, and submission; Mohammad Redwanur Rahman– Review and editing; Mahima Ranjan Acharjee and Subeda Newase- Data collection; Zannatul Nayma, Razia Sultana–Formatting and editing manuscript; Mohammed Nurul Absar Khan – Critically review; Shanur Jahedul Hasan– Providing fund for the research.