Farming practices and crop species influence the population of total and alkaline phosphatase gene harboring bacteria in tropical agro-ecosystem
Abstract
The alkaline phosphatase (ALP) enzyme is encoded by the phoD gene reported majorly in bacteria. In the present study, we investigated variation in the phoD gene abundance, and the relationship between phoD gene abundance, ALP enzyme activity and available P under different farming practice (organic vs conventional), crop species (chickpea, mustard, soybean and maize) and their growth stages (pre-vegetation, vegetative, flowering, maturation and post-harvest). The qPCR analysis revealed variation in total bacterial and phoD gene copy number (copies g−1dws), ranging from 1.40 × 10⁹ to 9.16 × 10¹⁰ and 1.72 × 10⁵ to 1.43 × 10⁷, respectively. The farming practices suggested significant effect with increased activity of ALP, and abundance of phoD and 16S rRNA genes in organic farming than the conventional one. The 16S rRNA and phoD gene abundance varied significantly along different growth stages of crops in the order: flowering > maturation > vegetative > post-harvest > pre-vegetation stages with maximum in maize and lowest in soybean in both the farming practice. In conclusion, farming practices, crop types and crop growth stages influenced soil available P and significantly affected ALP activity by regulating phoD bacterial population in agroecosystem.
Keywords
phoD gene copy number, alkaline phosphatase activity, available P, farming practices, crops
Introduction
Plant metabolic activities require phosphorus (P) as an indispensable element that plays a vital role in maintaining the soil fertility as well as crop productivity. In soil, abundant P is present, mainly in two forms as organic and inorganic P (Brady & Weil, 2007). However, in soil solution microbes and plants utilize P as inorganic orthophosphate (HPO4 2˗ or H2PO4 ˗). To enhance crop productivity, both mineral and organic P fertilizers are used in agroecosystems. Soon after application some amount of inorganic P is readily taken up by the microbes and plants whereas the unused phosphorous is immobilized which leads to the accumulation of P in soil (Richardson, 2001). Since phosphorous is the main limiting macronutrient in agricultural soil, many bacteria play an indispensable role in P-cycle to solubilize insoluble inorganic P (Pi) by producing organic acids, and mineralizing the organic form of P (Po) by releasing extracellular enzymes like acid and alkaline phosphatases (ALP) (Ragot, 2015). Researches have well acknowledged that acid phosphatase is produced mainly by plants, fungi and bacteria whereas, alkaline phosphatase is excreted by soil microbes mainly by bacteria (Nannipieri, Giagnoni, Landi, & Renella, 2011). The activity of phosphatase is generally higher in rhizosphere soil with increased microbial activity as compared to bulk soil (Fraser, 2017). It is also reported that the organic matter application in the soil increases the ALP activity, as a result, concentration of available P is increased (Mandal, 2007). There are some reports that the production and activity of alkaline phosphatase enzyme correlated negatively with available P in soil (Chen, 2019; Fraser, 2017; Long, 2018). According toApel (2007) the Pho regulon has been found mostly in bacteria, and consist of set of genes that are useful to synthesize and exudate phosphatase enzymes comprising alkaline phosphatase. As a segment of Pho regulon, alkaline phosphatase enzyme is encoded by 3 different genes (homologous): phoD (Sakurai, 2008), phoX (Wu, 2007), and phoA (Zappa, 2001) . The bacteria harbouring phoD genes are abundant among the different environments predominantly in the soil while phoX and phoA gene harboring bacteria are present in aquatic ecosystems (Hu, 2018). Previous studies showed that phoD gene is the most frequently present ALP gene in the terrestrial environment and has been used as an effective functional marker to study the relationship between ALP activity and available phosphorous (Ragot, 2016), and the abundance of ALP gene inhabiting the soil (Fraser, 2015a;b).
Several studies reported that the abundance of phoD gene containing bacterial community is affected by various environmental factors and agricultural management practices (Neal, 2017), soil pH (Ragot, 2016), organic matter (Chen, 2017), mineral fertilizer (Chen, 2017; Hu, 2018), cover crops (Hallama, 2022). A positive correlation was found between phoD gene abundance and ALP activity in response to chemical P fertilizer and manure application in soil but this correlation was not significant (Fraser, 2015a;b). Moreover, increased activity of ALP enzyme and abundance of phoD gene was reported in relation to long-term addition of organically amended soil (composted bean cake) as compared to chemically treated soil (Luo, 2017). Besides, it was reported that the effect of the addition of P (phosphate and phytate) on the total and ALP gene (phoD) harboring bacterial populations inhabiting the rhizosphere microsites (root tip and mature zone) of ryegrass. The qPCR of phoD, phoX and 16S rRNA gene showed increased abundance in root tip microsites amended with phytate as compared to phosphate (Lagos, 2016).Chen (2019) studied the effect of long-term mineral-P inputs in continuous maize cropping. The study showed the negative correlation of alkaline phosphatase enzyme with soil P availability and positive correlation with phoD gene abundance.
In the tropical agro-ecosystems of countries like India, there are very few studies available on the activity of soil ALP enzyme.Mandal (2007) conducted a field experiment to study the long-term effect of NPK fertilizer and farmyard manure on microbial biomass C, N, phosphatase (alkaline/acid) and dehydrogenase in soil. In another study, the effect of combined and individual input of various organic supplements and chemical P fertilizer was evaluated on the alkaline phosphatase activity in maize cropping (Garg, 2008).Saha (2008) studied the effects of continuous treatment of manure and chemical fertilizer on the enzymatic activities involved in mineralization of carbon, nitrogen and phosphorus.Bhat (2017) compared the biochemical activity in soil under long-term organic and conventional farming systems related to P-availability in vertisols of Central India grown with soybean and wheat. The study concludes that organic farming soil support increased biological activity. These studies limit the information on changes in microbial population lined to P-mineralization. Literature survey suggests that there are very few studies carried out on alkaline phosphatase encoding phoD gene abundance and most of the studies have been performed in temperate agroecosystems. It is therefore inevitable to understand the changes in phoD gene containing bacterial population and their relation with available P in tropical agroecosystem for sustainable agriculture. Most of the researches have restricted primarily on the activity of alkaline phosphatase enzyme in the diverse environment. Our understanding of bacterial phoD gene abundance, ALP activity, available P and their relationship under the influence of different crop species and fertilizer treatment in tropical agroecosystem is poorly understood and require further study.
In the present study, we hypothesized that different farming practices, crop species and crop growth stages can regulate the P availability in soil and influence phoD gene abundance and the soil ALP activity. The present study aimed to (1) determine the abundance of the phoD and 16S rRNA genes (2) study the variation in ALP activity and available P content, and (3) investigate the relationship between P-availability, ALP activity and phoD gene abundance in a tropical agro-ecosystem soils managed with different farming practices and crop species at different growth stages of the crops.
Materials and methods
Study site
The study was conducted for consecutive two years (2017-2019) at the Dagmagpur agricultural farm in the district of Mirzapur, Eastern Uttar Pradesh, India (83°34'E, 25°09'N), 80 m above mean sea level. The soil at the site is Alfisol with a silty sandy texture (32% sand, 64% silt and 4% clay). The climate of this area is seasonally tropical monsoonal and average annual precipitation of 849.9 mm. The average temperature (minimum-maximum) varies from 8°C (January) to 42°C (June). The agricultural farm was managed by the farmer and the site has been used for intensive agriculture practices for a long time (≈30 years).
Experimental design
For the current study, two agricultural farms/fields having different farming practices were chosen: one field was treated with compost (organic farming) and the other with mineral fertilizers (conventional farming). The experimental design for sample collection consists of a randomized complete block design with three blocks at each site (5×4 m each with 1 m gap) and a treatment combination of 4 crops × 2 farming practices (total 24 blocks). The conventional and organic farming plots were separated by 100 m distance to avoid edge effects. In the conventional field, as per standard farming practice, mineral fertilizers, NPK (120,40 and 60 kg ha-1 for Rabi crops and 20, 40 and 60 kg ha-1 for Kharif crops) was applied once both during Rabi and Kharif cropping as a basal dose. The organic farming field was treated with compost which was used as organic supplement and comprised of cattle dung and crop residues prepared by NADEP (Narayan Deorao Pandharipande) technique (Chandra, 2007). The ripe compost was distributed manually (at the rate of 15 tonnes ha-1) and ploughed to incorporate up to 15 cm depth before Rabi and Kharif cropping. Any other supplement was not added except for diluted cow urine (1:50; cow urine: water ratio) as the source of nitrogen (Singh, 2012). To ensure comparability under both the farming system the cultivation practices (soil preparation, sowing of seed, and irrigation) were managed uniformly. The Rabi cropping extends from November to March and Kharif from July to October. The seed sowing rate is depicted in Table S1. Irrigation was done as per the standard norms i.e. before flowering and at the time of grain formation for chickpea, mustard and maize, and before the emergence of plant and during pod formation for the soybean crop. The Rabi crops comprised Chickpea (Cicer arietinum L. var Pusa-256) and mustard (Brassica campestris var. T-151) and Kharif crop includes Soybean (Glycine max var.PS-1225) and maize (Zea mays var. Ganga II). Pesticides/ fungicides were not applied in both experimental fields, and weeds were removed manually. Conventional tillage was performed and ploughed up to depth of 10-15 cm under both the farming practices.
Soil sampling
The experimental plots for each crop in different farming practices (organic vs conventional) comprised of three blocks and from each block, soil samples in triplicate were sampled at different time intervals of cultivation period i.e. vegetative, flowering, maturation including pre-vegetation and post-harvest stage. Rhizosphere soil samples were collected from the vegetative, flowering and maturation stage of the all test crops. Three plants from each plot of four crops (chickpea, mustard, soybean and maize) were uprooted and soil adhering roots were shaken gently to dislodge the soil clumps in a plastic bag and bulk soil samples were collected at pre-vegetation and post-harvest stage from 0-10 cm depth using a soil corer (5 cm diameter) and carried to the laboratory within 12 hours of sampling. The soil samples were sieved with a 2 mm sieve to remove plant debris and stone. The samples (pooled) were separated into two parts: one kept (4°C) for soil alkaline phosphatase (ALP) enzyme activity and the other (at -20°C) for molecular study (qPCR). All the measurements were carried out in triplicate for two consecutive years.
Soil variables and microbial biomass
Soil pH was determined by using a pH meter. Soil characteristic parameters such as texture, water holding capacity (WHC) and bulk density were determined by the standard method as described byBhardwaj (2020). Soil organic carbon (SOC) was estimated as perWalkley (1947) and total nitrogen (TN) is measured by the micro Kjeldahl method (Jackson, 1958). Total P was analyzed by the method described byAllen (1986). Triacid mixture (HCl04, HNO3, and H2SO4 at 1:5:1) was used to digest the soil, and total P was analyzed spectrophotometrically using protocol based on ammonium molybdate-stannous chloride. Soil available P content was estimated as perOlsen (1954). MBC (microbial biomass carbon), MBN (microbial biomass nitrogen) and MBP (microbial biomass phosphorus) were measured as per standard protocol based on chloroform fumigation extraction method.
Crop biomass
To measure crop biomass, plants were collected at the vegetative, flowering and maturation stages of each test crop plant in three replicates and cleaned with water to remove the adhered soil. The root and shoot of these crop plants were segregated and dried constantly in the oven (at 80°C) and measured to determine crop (root and shoot) biomass in g plant-1 on an oven dry-weight basis (Wang, 2017).
Alkaline phosphatase (ALP) enzyme activity assay
Potential ALP activity of soil samples was determined as per the method described byTabatabai and Bremner (1969). The soil samples (1g) in triplicate were incubated (1 hour at 37 °C) with 1 ml modified universal buffer and para-nitrophenol phosphate as substrate at pH 11. Samples were filtered (Whatman 42 filter paper) after 1 hour of incubation and the synthesis of p-nitrophenol (p-NP) was measured using spectrophotometer (at 420 nm). The values were presented as µmol of p-NP g-1 soil h-1.
Soil DNA extraction, quantification of phoD gene and 16S rRNA gene copy number (abundance)
Genomic DNA was extracted from soil (0.5 g) in triplicate by Fast DNA Spin Kit (MP Biomedicals, Ohio, USA) using a bead beater (FastDNAprep, MP Bio, USA) following manufacturer’s protocol. The concentration and purity of DNA was determined using Nanodrop 2000 spectrophotometer (Thermo Fisher Scientific Inc., USA).
The abundance of bacterial phoD gene and 16S rRNA was performed by qPCR using iCycler iQ5 thermocycler (Bio-Rad). Gene copy number (phoD gene and 16S rRNA gene) was quantified using a specific set of primer (phoD gene: ALPS-F730; ALPS-R1101; 16S rRNA: Eub 338F, Eub 518R) as described in (Sakurai, 2008) and (Muyzer, 1993), respectively. The PCR reaction mixture contained 10 µl of PowerUpTM SYBR Green Master Mix (Applied Biosystem), 0.5 µl of each primer (10 µM), and 2 µl of DNA template and DNAase/RNAase free water to maintain final volume upto 20 µl. The PCR reaction was performed in duplicate for each sample and for plasmid standards, the samples were analyzed in triplicates.
The PCR cycling conditions for bacterial phoD gene: three min at 94°C subsequently by 40 cycles of denaturation for 1 min (at 94°C), annealing (at 61°C) for 45 secs and eventually extended at 72°C for 1 min. For bacterial 16S rRNA gene, the PCR conditions were 3 min at 95°C followed by 40 cycles of 45 sec of melt at 95°C and annealing at 60°C and extension at 72°C for 45 sec. To check the reaction specificity, analysis of melting curve was performed with heat denaturing by increasing the temperature from 50°C to 95°C for 40 cycles and fluorescence was recorded for every 0.5°C increase. The plasmid DNA harboring the marked gene from the soil samples containing ALP and 16S rRNA gene was taken as the standard DNA in qPCR analysis by cloning using the specific primer described above. The plasmid was isolated using HiPurA (TM) Plasmid DNA Miniprep Purification Kit (Himedia) using the manufacturer’s protocol. The standard curve was plotted in triplicate with 10-fold dilutions of cloned plasmid DNA. As per the standard curves, the gene copy number of phoD and 16S rRNA were expressed in g-1dws (dry weight soil).
Statistical analysis
Multivariate analysis of variance (MANOVA) with Tukey post hoc test (p < 0.05) was used to analyze the significant effect of farming practices and crop species on properties of soil and gene copy number. The effect of growth stages on the properties of soil and abundance of genes was evaluated by repeated-measures ANOVA. Regression analysis was used to determine the correlation between phoD gene abundance, PO4 −-P and activity of alkaline phosphatase in rhizosphere soil. Statistical data analyses were conducted through SPSS 20.0 software (IBM, SPSS, Inc., NY, USA).
Results
Soil variables, microbial biomass (C, N, and P)
The total organic C (TOC), total P (TP) and total N (TN) contents were higher in soils subjected to organic farming in comparison to conventional ones (Table 1). The available P content was highest in conventional farming at the pre-vegetation stage and lowest at the flowering stage of all the four crops and the values were highest in soybean grown fields (Table 2). The effect of crops, farming practices and growth stages showed a significant (p < 0.05) effect. Mineral-N was highest in conventional farming at the flowering stage and lowest at the pre-vegetation stage for all the crops. There was a significant (p < 0.05) effect of farming practice and growth stages on variation in mineral-N and available P (Table 2). Soil MBC, MBN and MBP were significantly higher (p < 0.05) in organic farming than the conventional farming. MANOVA revealed a significant (p < 0.05) effect of farming practice, crop type and crop growth stages on microbial biomass C, N and P (Table 2).
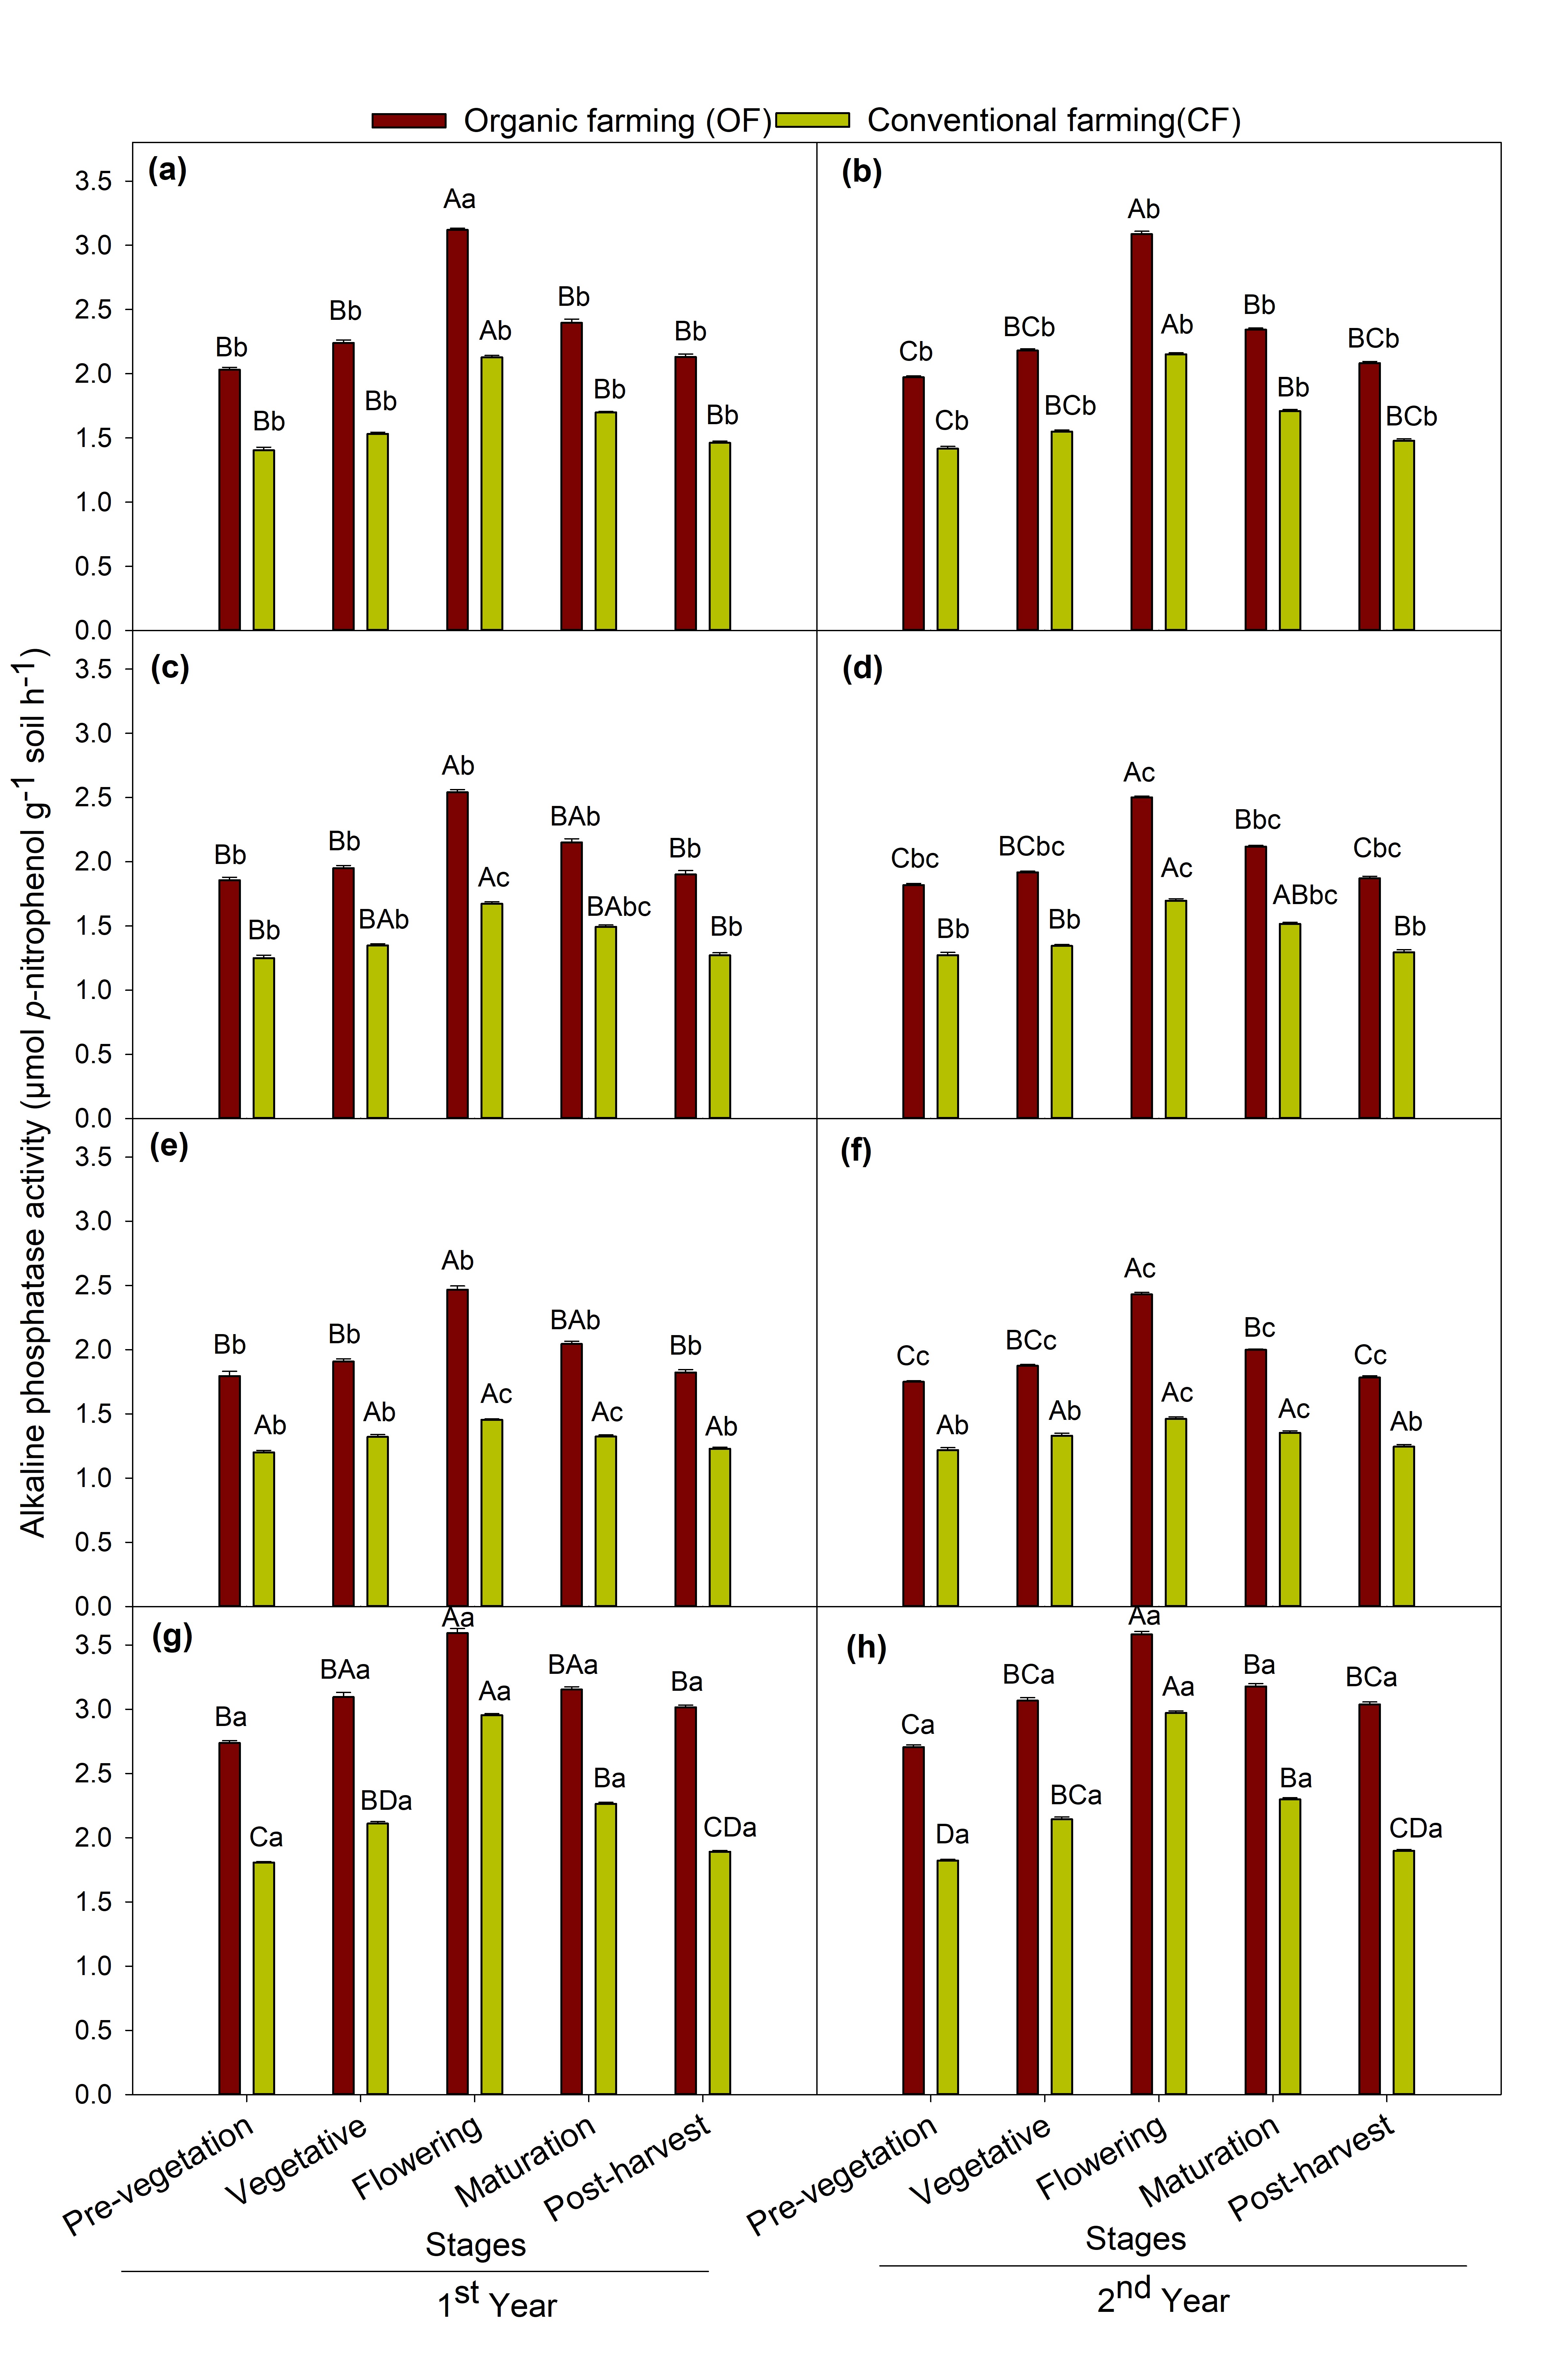
Alkaline phosphatase (ALP) activity of soil
Alkaline phosphatase activity ranged from 1.75 to 3.59 µmol p-nitrophenol g−1soil h−1 in organic farming and 1.20 to 2.97 µmol p-nitrophenol g−1soil h−1 in conventional farming soil. The ALP activities were highest in organic farming than the conventional farming practice. Among different crops, maize crop showed the highest ALP enzyme activity followed by chickpea, mustard and the lowest in soybean (Fig. 1). Irrespective of crops similar trend of variation in the ALP activity in soil was seen between the crop growth stages and the values were highest at the flowering stage followed by maturation > vegetative > post-harvest > pre-vegetation stages. MANOVA showed a significant (p < 0.001) effect of farming practice and crop species and repeated measures ANOVA showed significant (p < 0.001) effect of crop growth stages on ALP enzyme activity during both year of study.
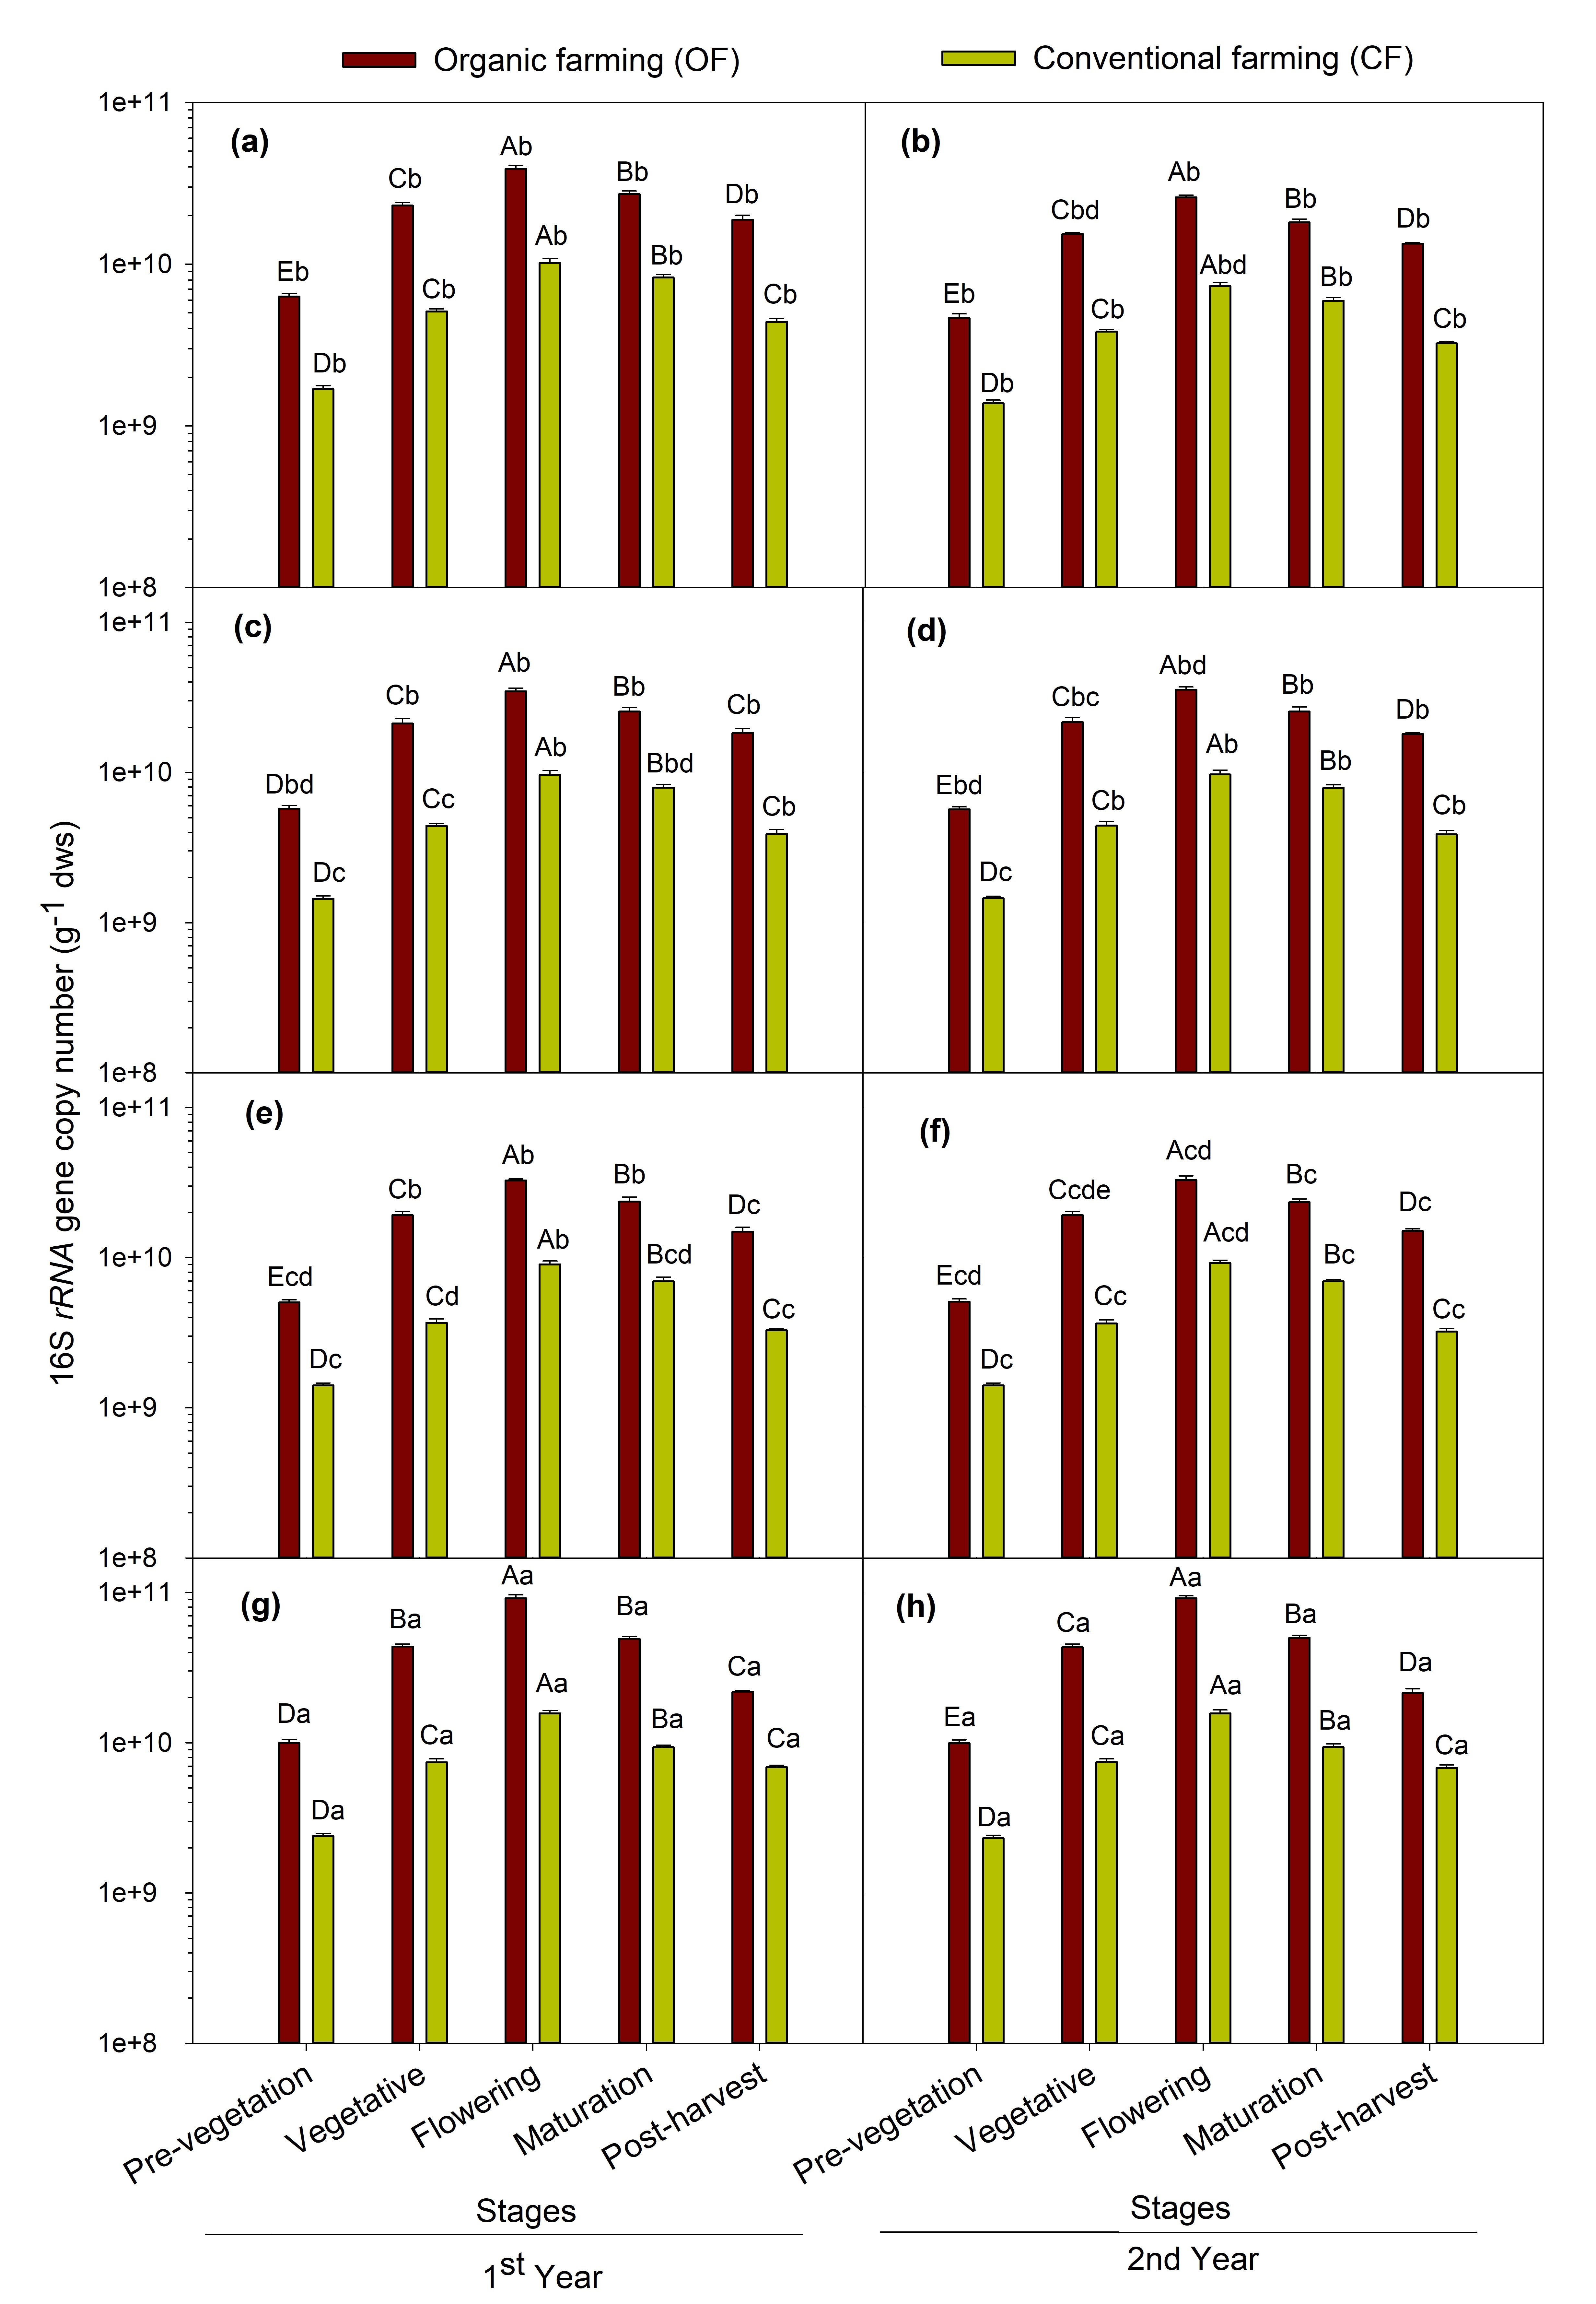
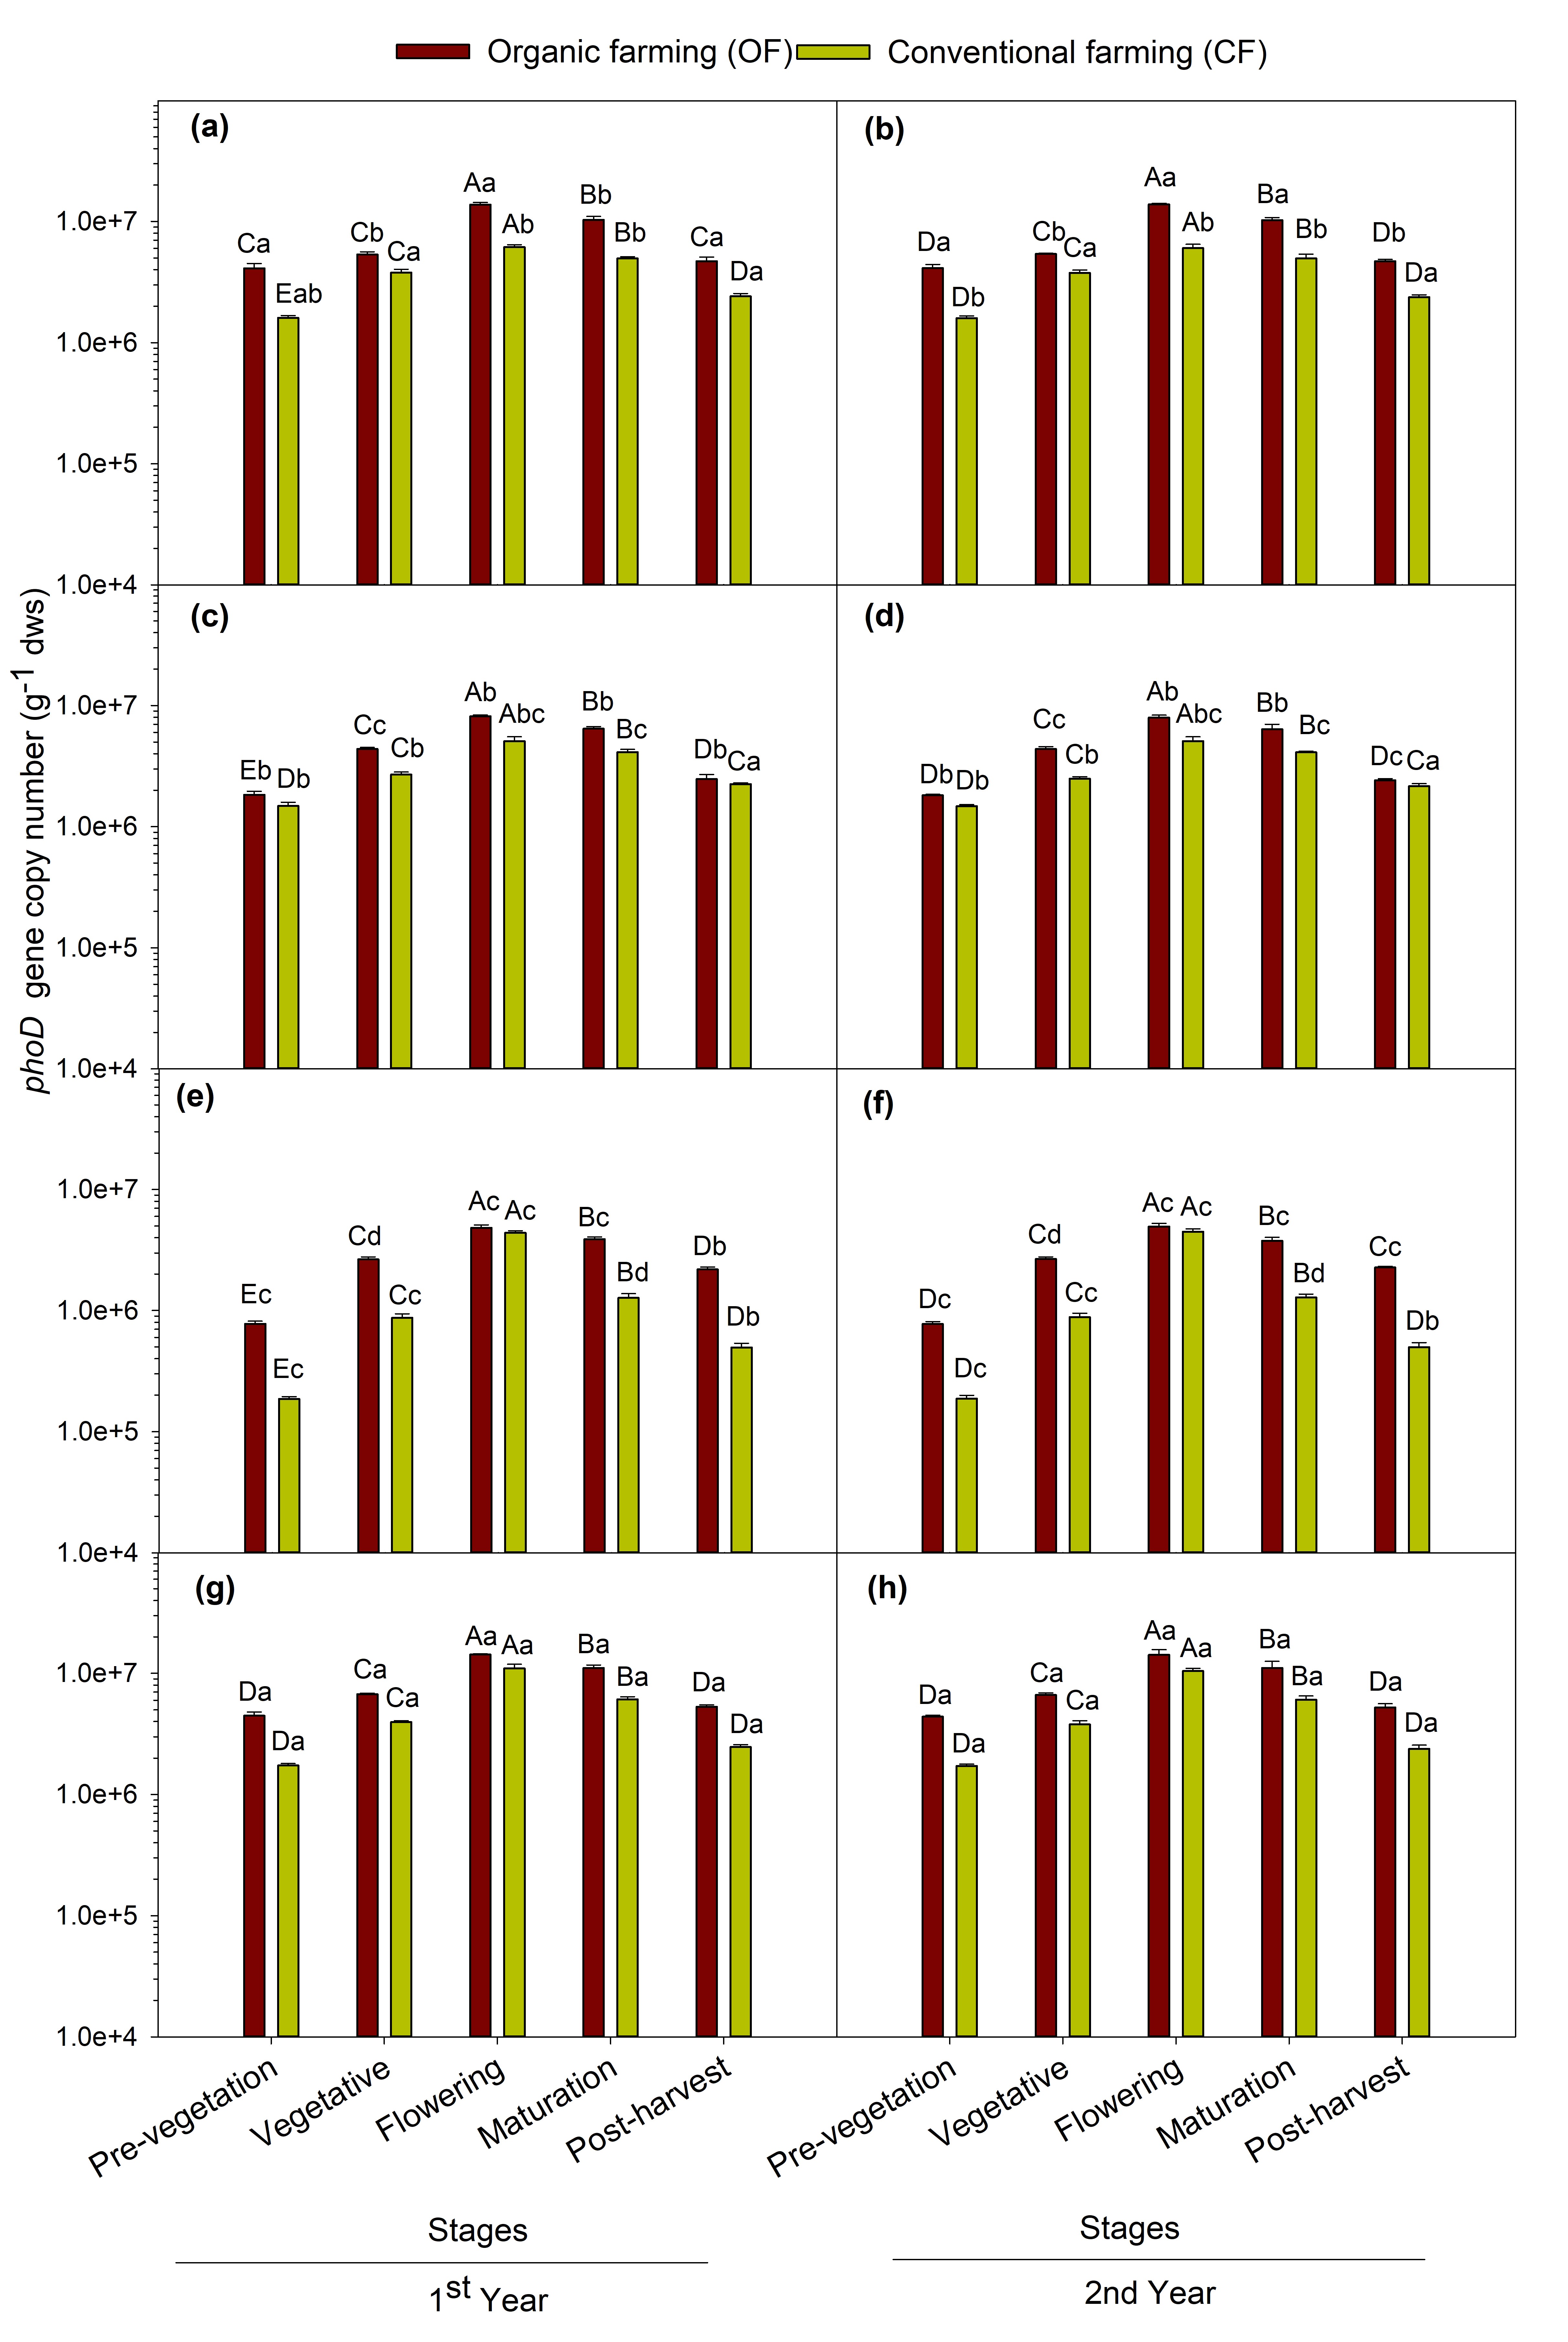
Abundance of phoD gene and 16S rRNA gene
The qPCR result revealed the abundance of 16S rRNA gene and phoD gene copy number for both years are shown in Fig. 2 and 3 respectively. The abundance of the 16S rRNA gene was higher in organic farming which ranged between 5.03×10⁹ and 9.16×10¹⁰ copies g−1 dws and from 1.40×10⁹ and 1.57×10¹⁰ copies g−1 dws in conventional farming fields. The abundance of phoD gene ranged from 7.72×10⁵ to 1.43×10⁷ copies g−1 dws in organic farming and 1.86×10⁵ to 1.10×10⁷ copies g−1 dws in conventional farming. The phoD gene abundance was higher in organic farming practice than the conventional one. The population size of 16S rRNA and phoD gene was recorded highest in soils samples of maize crop followed by chickpea, mustard, and least in soybean grown soils. Among the crop growth stages, phoD and 16S rRNA gene abundance showed the same trend as ALP activity i.e. the flowering stage showed the maximum abundance followed by maturation > vegetative > post-harvest > pre-vegetation stages. The MANOVA showed significant (p < 0.001) effect of farming practices, and crops and repeated measures ANOVA showed significant (p < 0.001) effect attributable to crop growth stages on the abundance of total bacterial (16S rRNA) and phoD gene abundance.
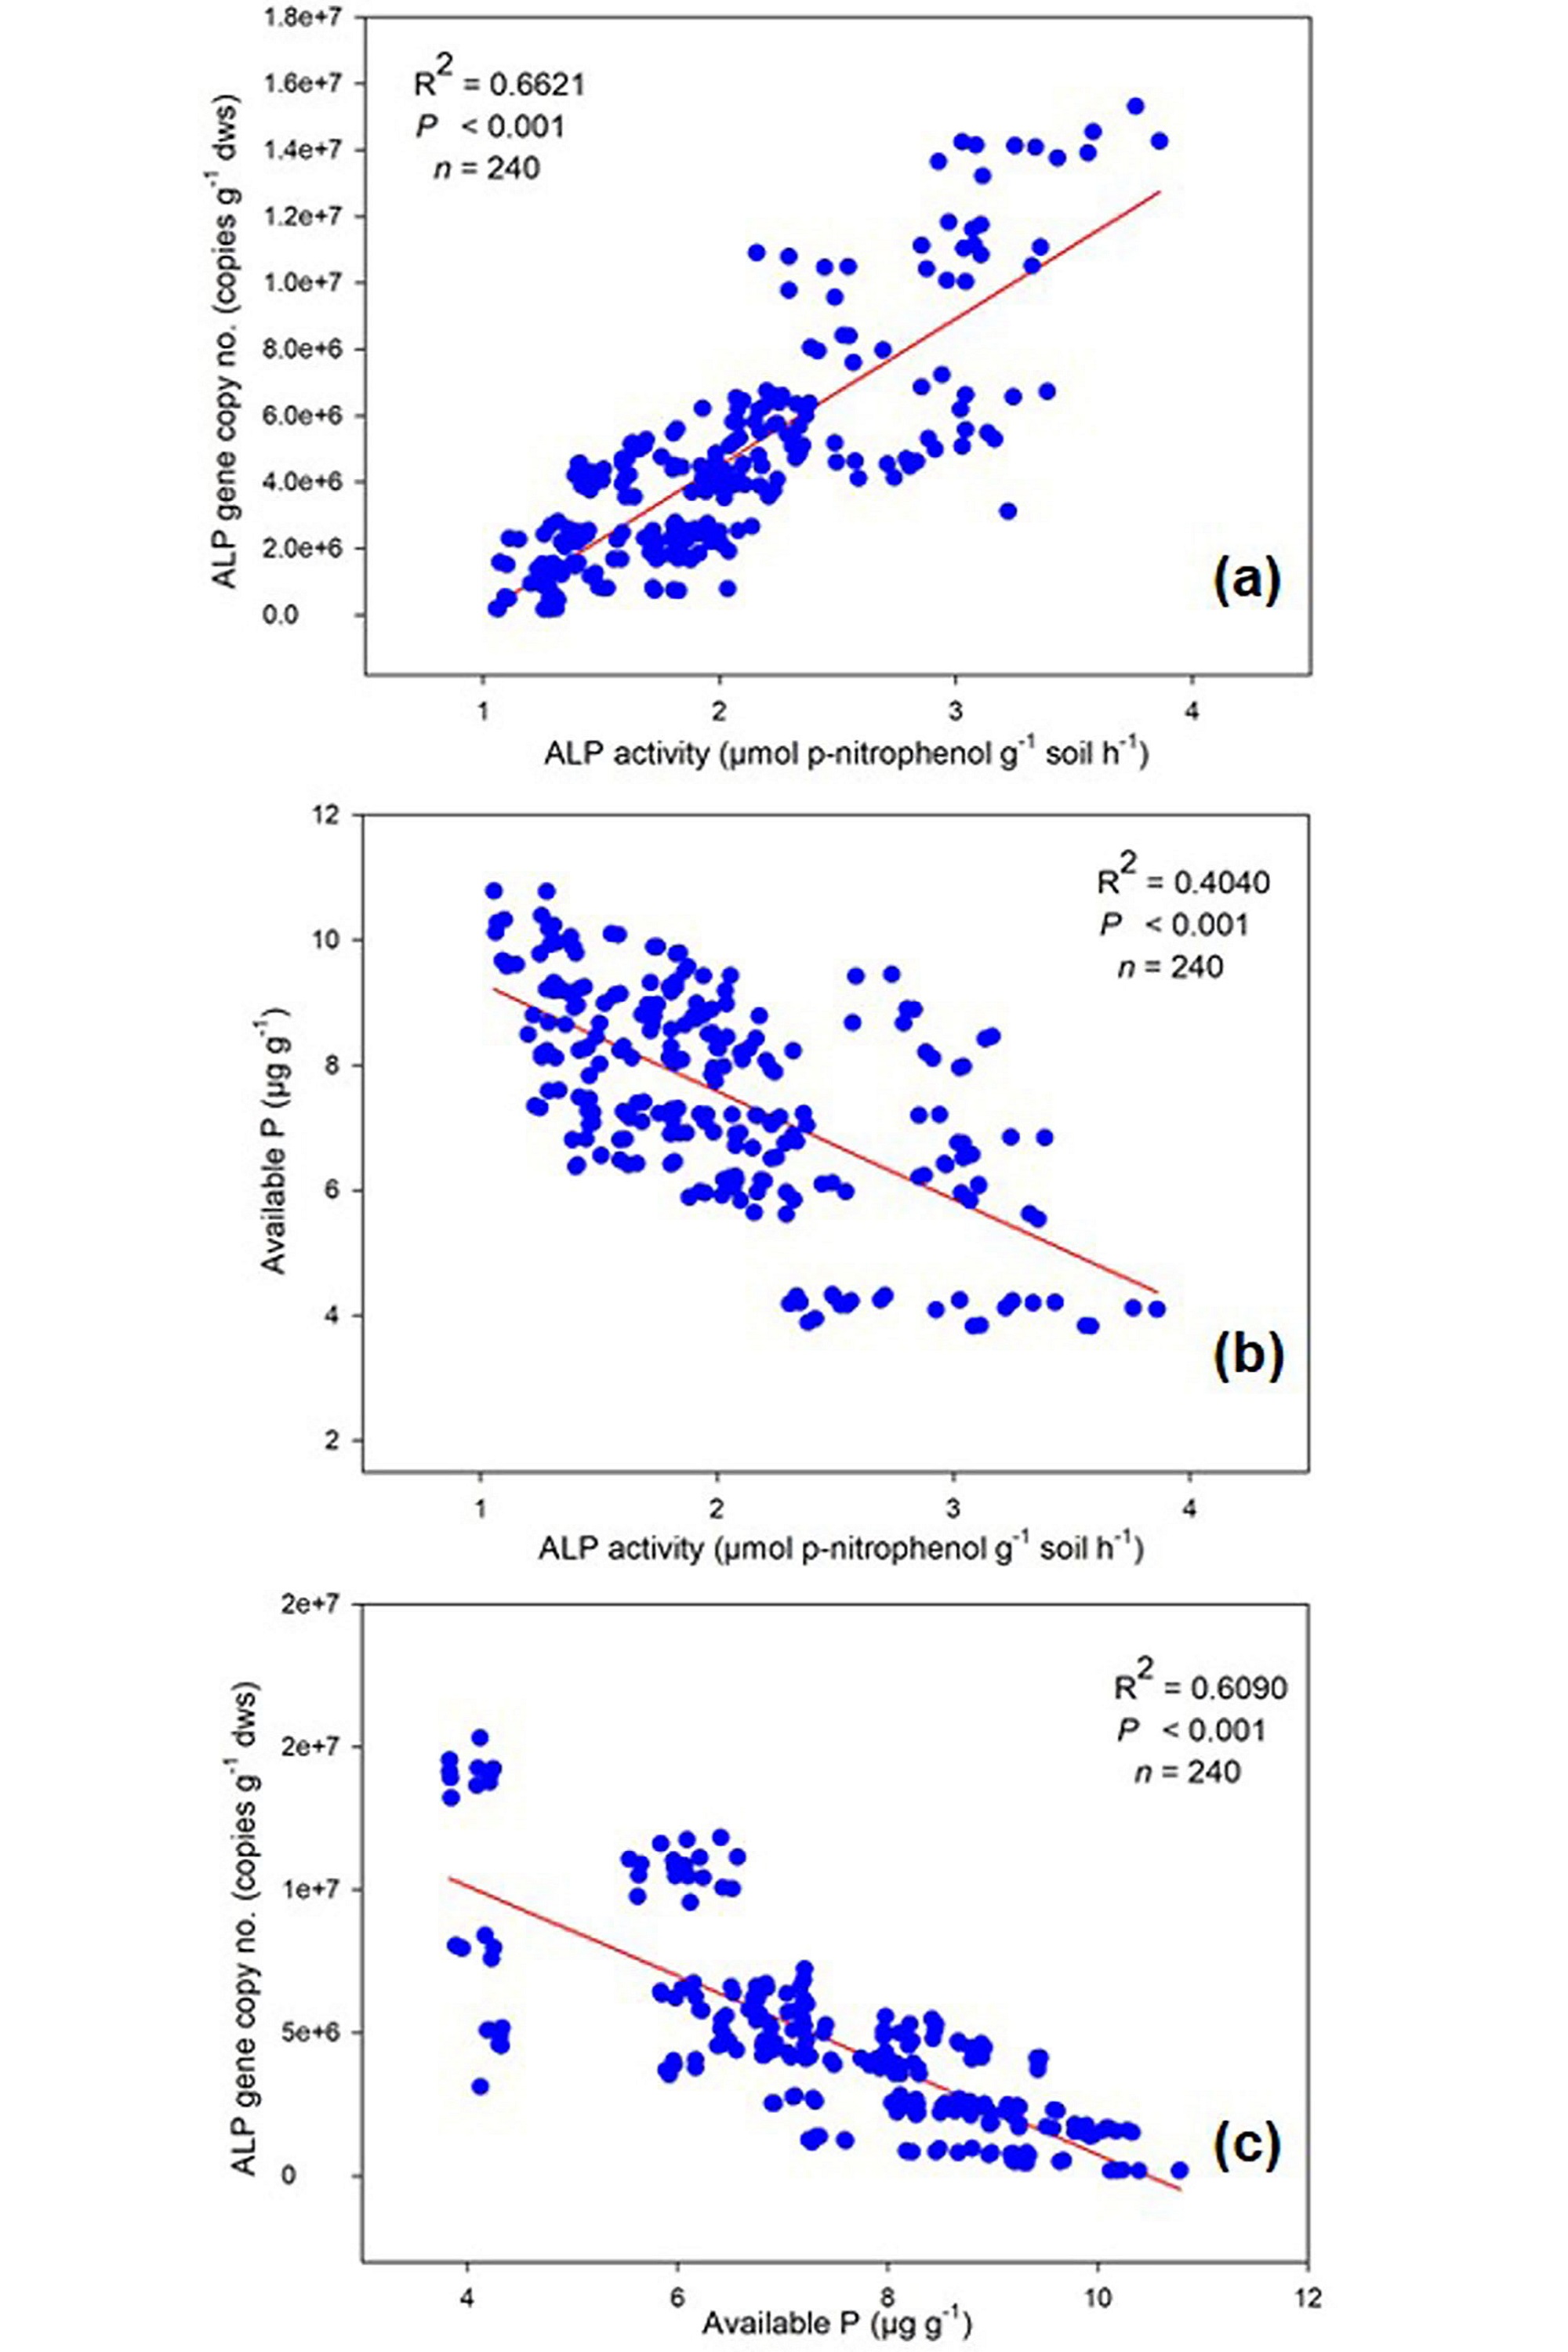
Relationship between available P, ALP activity and phoD gene abundance
Soil samples with higher phoD gene abundance exhibited correspondingly increased rates of soil ALP activity and decreased available P. The results of regression analysis revealed that there was significant positive correlation (R2 = 0.66, P < 0.001) between ALP enzyme activity and phoD gene abundance (Fig.4a). On the other hand, a negative correlation was observed between ALP activity and available P content of soil (R2 = 0.40, P < 0.001) and also phoD gene copy number and available P (R2 = 0.60, P < 0.001) (Fig. 4b and c).
Crop biomass
The crop root biomass ranged from 0.65 to 4.11 and 3.68 to 37.20 g plant−1in organic farming and 0.54 to 2.49 and 3.02 to 32.35 g plant−1 in conventional farming practice, respectively (Table 3). The result showed higher root and shoot biomass in organic farming practice irrespective of crops. There were significant (p < 0.05) variations (crop-wise) observed in root and shoot biomass with maize having the highest, and lowest in soybean crop. Stage-wise differences in all the crops were significant (p < 0.05). Among the different crop growth stages, the flowering stage showed the highest biomass and least in the vegetative stage.
Discussion
Soil variables
The long-term organic farming practice promotes SOC, TN and TP in soil (Table 1). MBC, MBN and MBP increase with respect to the organic farming practice and enhance the soil biological activity compared to a conventional counterpart at different growth stages of test crops i.e. chickpea, mustard, soybean and maize crops (Table 2). The soil amended with organic manure was well-established to enhance organic matter (Edmeades, 2003). Organic farming soil showed increased level of organic matter (Kaufman, 2020) and the soil rich in organic matter have long-term potential to sustain nutrient release (Rochette, 1999) and crop productivity in agro-ecosystems (Guo, 2012). The compost-treated soil showed a slightly higher pH in comparison to conventional farming soil. This decline in pH in chemical fertilizer treated soil may be due to nitrification of NH4 + thus H+ ion is produced and enhances the soil acidity. This result seems consistent as per the outcomes of McAndrew (1992).Chakraborty (2011) also showed similar findings in which they reported that the increase in the application of chemical fertilizer considerably decreased the soil pH. In the present study, the available P significantly (p < 0.05) increased in conventionally treated soil (Table 2). This trend is in accord withLiu (2010). However,Fraser (2015a;b) observed an opposite trend. This may be because of confounding factors like the proportion of P in mineral fertilizers, several management practices and crop requirements for P (Fraser, 2015a;b; Welsh, 2009). Apart from farming practices, crops and crop growth stages also influence nutrient availability by altering the degree of root exudates and root biomass. In this study, a significant (p < 0.05) effect of different developmental stages of crops on available P was observed. This may be due to disparity among the amount of available nutrients between the crop growth stages might be credited to plant-microbe competition for nutrient assimilation (Devare, 2004).
Effect of farming practice on soil alkaline phosphatase activity and abundance of phoD gene
The present study provides insight into the assessment of P availability, ALP activity and alkaline phosphatase gene (phoD) quantification in organic and conventionally treated rhizosphere soil. The present study showed increased ALP activity in the plots with organic farming which show increased activity of ALP gene harboring bacteria in response to compost application than in conventional farming plots. This result was consistent with the earlier studies which reported enhanced ALP activity (Mandal, 2007; Yang, 2006) and bacterial phoD gene abundance (Chen, 2019) in the fields managed under organic farming practices. This may be because of the high organic matter content in the soil treated with compost.Crecchio (2001) studied that organic matter amendment in the soil enhances the activity of several soil enzymes like nitrate reductase, dehydrogenase, etc.Saha (2008) communicated that cattle manure amendment in soil results in a significant increase in alkaline phosphatase activity. Moreover, from providing substrate for hydrolysis of the enzyme, organic matter content in the manure possibly increase in binding sites for enzyme accumulation in the soil (Burns, 1982).The total bacterial (16S rRNA gene) gene copy number ranged from 1.40×10⁹ to 9.16×10¹⁰ copies g−1 dws with the highest values observed in organic farming and lowest in conventional one.Singh (2012) observed similar range of bacterial 16S rRNA gene abundances (9.60×10⁹ to 1.44×10¹⁰ copies g−1 dws) in soil samples in compost treated rice cultivated field of tropical soil. The abundance of 16S rRNA gene in Chilean extreme environments ranged between 8.6×10⁷ and 19×1010 copies g−1 dws (Acuña, 2016) .The increased number of total bacteria in organic farming practice may be because organic fertilizers not only carry various forms of organic compounds, as well as indigenous bacteria present in manure that may reside in soil (Pershina, 2015).The studies on the population distribution of phoD gene harboring bacteria in tropical agroecosystem are almost negligible. Therefore, our study can be compared with available data of other agroecosystems with similar techniques used for the study of population abundance.Fraser (2015a;b) reported phoD abundance values ranging between 3×10⁶ and 1×10⁷ copies g−1 soil in long-term organic fertilizer management. The qPCR analysis of alkaline phosphatase gene (phoD) harboring bacteria, we observed abundance in the range between 1.86×10⁵ and 1.43×10⁷ gene copies g−1 dws. In organic farming treated field soils, the abundance of phoD genes was highest. Similar results were obtained in the long-term manure fertilized soil (Fraser, 2015a;b).It is observed that significant (p < 0.05) highest abundance of phoD gene was observed in organic treatment soil with highest (p < 0.05) alkaline phosphatase activity and highest SOC which shows increased organic matter content and consequently increases bacterial abundance (Sun, 2015). In organic farming, the organic fertilizers low in available P content and high in C rich substance may be responsible for the stimulation of various phoD gene encoding microbes and as a result increases the phoD gene abundance and ALP activity (Luo, 2017). Similarly, (Chen, 2019) reported that ALP activity and bacterial phoD gene abundance were reduced significantly in mineral fertilizer treated soil. This may be due to several factors including increased soil acidity. The ALP activity and phoD gene abundance have been related to soil available P in manure and inorganic fertilizer treated soil (Chhabra et al., 2013; Sakurai, 2008). It is well established that there is a negative correlation between soil available P and alkaline phosphatase activity and phoD gene abundance. These observations are in accordance with the widely consented fact that activity of alkaline phosphatase is governed by the soil available P and increased in response to P starvation (Chen, 2019; Zhang, 2014). Consistent with the above fact, in the present study, soil available P is negatively correlated with ALP activity and phoD gene abundance (Fig. 4b and c) and a positive correlation was found between ALP activity and bacterial phoD gene copy number (Fig. 4a). This result corroborates the previous study where a correlation (negative) was found between PO4 −- P and phoD gene abundance in an upland soil ecosystem (Luo, 2017; Tan, 2013). In another study, a similar negative relationship was reported between soil available P and bacterial alkaline phosphatase activity, while a positive relationship between ALP activity and gene abundance, in the rhizosphere soil from plants of extreme environment of Chile (Acuña, 2016) . This result suggests that alkaline phosphatase enzyme production is induced in the environment with low available P (Fraser, 2015a;b).
|
Farming practice |
||
|---|---|---|
|
Soil parameters |
Organic |
Conventional |
|
Soil texture (%) (sand:silt:clay) |
32:64:4 |
32:64:4 |
|
Water holding capacity (%) |
35.93 ± 1.31 |
35.17 ± 0.83 |
|
Bulk density (g cm-3) |
1.25 ± 0.02 |
1.34 ± 0.03 |
|
Total organic carbon (%) |
0.83 ± 0.02 |
0.59 ± 0.02 |
|
Total nitrogen (%) |
0.18 ± 0.002 |
0.10 ± 0.003 |
|
Total P (µg g−1) |
152.17 ± 12.37 |
127.08 ± 6.60 |
|
pH |
7.38 ± 0.15 |
7.30 ± 0.15 |
|
Farming practice (FP) |
Organic Farming (OF) |
Conventional Farming (CF) |
|||||||||
|
Stages |
Crop species |
Mineral-N (µg g-1 dws) |
Available-P (µg g-1 dws) |
MBP (µg g-1 dws) |
MBC (µg g-1 dws) |
MBN (µg g-1 dws) |
Mineral-N (µg g-1 dws) |
Available-P (µg g-1 dws) |
MBP (µg g-1 dws) |
MBC (µg g-1 dws) |
MBN (µg g-1 dws) |
|
1st year |
|||||||||||
|
1 |
Chickpea |
9.51 aD |
9.04 aA |
7.26 bD |
202.05 bC |
20.89 bD |
10.01 aC |
9.97 abA |
5.24 bD |
165.09 bC |
18.86 bC |
|
Mustard |
9.61 aD |
9.06 aA |
6.27 bD |
191.45 bcD |
17.76 cC |
10.11 aC |
10.03 abA |
5.04 bD |
124.36 cD |
17.85 bD |
|
|
Soybean |
9.58 aD |
9.17 aA |
5.88 bD |
172.30 cC |
14.47 dD |
10.05 aC |
10.45 aA |
4.72 bD |
122.83 cC |
15.41 cD |
|
|
Maize |
9.72 aD |
8.99 aA |
8.80 aD |
238.43 aD |
25.65 aD |
10.33 aC |
9.73 bA |
6.32 aC |
193.03 aC |
21.01 aD |
|
|
2 |
Chickpea |
11.40 aC |
6.96 aC |
12.10 bC |
268.00 abB |
25.24 cC |
12.74 aB |
8.14 aC |
11.42 abBC |
220.56 bB |
21.97 bB |
|
Mustard |
11.44 aC |
7.01 aC |
11.35 bcC |
247.93 bC |
22.59 cB |
12.82 aB |
8.36 aC |
10.70 bcB |
190.18 cB |
20.34 bcC |
|
|
Soybean |
11.97 aC |
7.11 aC |
10.02 cC |
243.67 bB |
18.51 bC |
12.91 aB |
8.45 aC |
9.05 cBC |
182.69 cB |
19.11 cC |
|
|
Maize |
11.81 aC |
6.93 aC |
14.71 aBC |
291.73 aBC |
35.40 aC |
13.02 aB |
7.94 aB |
13.29 aB |
246.90 aB |
25.04 aC |
|
|
3 |
Chickpea |
14.92 aA |
4.07 aE |
18.37 abA |
401.06 aA |
40.70 bA |
15.31 aA |
6.49 aE |
14.63 abA |
312.91abA |
30.43 abA |
|
Mustard |
14.59 aA |
4.10 aE |
16.51 bcC |
389.52 aA |
33.34 cA |
15.18 aA |
6.55 aE |
13.94 bA |
300.24 bA |
28.50 bcA |
|
|
Soybean |
14.70 aA |
4.28 aE |
15.43 cA |
379.24 aA |
24.88 dA |
15.14 aA |
6.60 aE |
12.24 cA |
261.89 cA |
26.84 cA |
|
|
Maize |
14.95 aA |
4.04 aE |
19.51 aA |
416.64 aA |
52.68 aA |
15.29 aA |
6.38 aD |
15.74 aA |
338.22 aA |
32.63 aA |
|
|
4 |
Chickpea |
12.71 aB |
5.92 aD |
15.30 abB |
294.71 aB |
29.39 bB |
13.32 aB |
7.24 aD |
12.46 abAB |
234.7 bB |
26.67 bB |
|
Mustard |
12.46 aB |
5.99 aD |
14.50 abB |
264.52 abB |
23.79 cB |
13.41 aB |
7.27 aD |
10.91 bcB |
202.73 cB |
22.83 cB |
|
|
Soybean |
12.81 aB |
6.01 aD |
13.87 bB |
258.74 bB |
21.83 cB |
13.09 aB |
7.41 aD |
10.19 cB |
196.39 cB |
21.04 cB |
|
|
Maize |
12.95 aB |
5.89 aD |
16.11 aB |
322.69 aB |
40.12 aB |
13.53 aB |
7.12 aC |
13.59 aB |
264.49 aB |
29.38 aB |
|
|
5 |
Chickpea |
9.89 aD |
8.22 aB |
11.88 abC |
223.45 bC |
24.16 bC |
10.63 aC |
9.09 abB |
9.24 bC |
173.85 bC |
19.62 bC |
|
Mustard |
9.85 aD |
8.30 aB |
10.81 bcC |
196.64 cC |
19.04 cC |
10.96 aC |
9.31 aB |
8.98 bC |
159.34 bC |
17.89 cD |
|
|
Soybean |
10.16 aD |
8.57 aB |
9.71 cC |
182.08 cC |
15.89 dD |
10.75 aC |
9.40 aB |
8.14 bC |
130.26 cC |
16.62 cD |
|
|
Maize |
10.09 aD |
8.20 aB |
13.11 aC |
256.91 aD |
28.36 aD |
10.64 aC |
8.47 bB |
11.95 aB |
210.34 aC |
22.76 aD |
|
|
2nd year |
|||||||||||
|
1 |
Chickpea |
9.52 aD |
9.05 aA |
7.28 bD |
202.75 bC |
21.19 bD |
10.05 aC |
10.02 aA |
5.26 bD |
166.73 bC |
18.75 bC |
|
Mustard |
9.63 aD |
9.07 aA |
6.29 bD |
190.53 bcC |
18.06 cC |
10.13 aC |
10.05 aA |
5.03 bD |
123.56 cD |
18.01 bD |
|
|
Soybean |
9.60 aC |
9.15 aB |
5.89 bD |
173.68 cC |
14.77 dD |
10.07 aC |
10.38 aA |
4.73 bD |
121.44 cC |
15.35 cD |
|
|
Maize |
9.76 aD |
9.01 aB |
8.81 aD |
240.37 aD |
25.66 aD |
10.29 aC |
9.75 aA |
6.31 aC |
192.05 aC |
21.35 aD |
|
|
2 |
Chickpea |
11.38 aC |
6.94 aC |
12.12 bC |
267.88 aB |
25.11 bC |
12.79 aB |
8.12 aC |
11.41 abBC |
218.87 bB |
21.92 bB |
|
Mustard |
11.44 aB |
7.02 aC |
11.37 bcC |
248.23 abB |
22.38 cB |
12.85 aB |
8.34 aC |
10.71 bcB |
189.63 cB |
20.88 bcC |
|
|
Soybean |
11.99 aC |
7.10 aC |
10.03 cC |
242.28 abB |
18.66 dC |
12.94 aB |
8.50 aC |
9.07 cBC |
181.31 cB |
18.98 cC |
|
|
Maize |
11.89 aA |
6.94 aC |
14.73 aC |
290.88 aBC |
35.50 aC |
13.01 aB |
7.92 aB |
13.30 aB |
247.49 aB |
24.96 aC |
|
|
3 |
Chickpea |
14.96 aA |
4.05 aE |
18.37 abA |
400.75 abA |
40.11 bA |
15.38 aA |
6.47 aE |
14.64 abA |
313.24 abA |
30.70 abA |
|
Mustard |
14.47 aA |
4.12 aE |
16.53 bcA |
391.16 abA |
33.46 cA |
15.09 aA |
6.57 aE |
13.95 bA |
298.79 bA |
28.60 bcA |
|
|
Soybean |
14.69 aA |
4.27 aE |
15.45 cA |
376.47 bA |
24.38 dA |
15.07 aA |
6.56 aE |
12.24 cA |
262.22 cA |
26.40 cA |
|
|
Maize |
14.83 aA |
4.06 aE |
19.53 aA |
415.74 aA |
52.60 aA |
15.35 aA |
6.41 aD |
15.75 aA |
337.85 aA |
32.30 aA |
|
|
4 |
Chickpea |
12.75 aB |
5.90 aD |
15.32 abB |
293.37 abB |
30.04 bB |
13.34 aB |
7.26 aD |
12.47 abAB |
235.34 bB |
26.71 bB |
|
Mustard |
12.44 aB |
6.02 aD |
14.52 abB |
265.40 bB |
24.13 cB |
13.46 aB |
7.25 aD |
10.92 bcB |
199.88 cB |
23.09 cB |
|
|
Soybean |
12.89 aB |
6.02 aD |
13.88 bB |
260.10 bB |
21.55 cB |
13.07 aB |
7.39 aD |
10.20 cB |
197.67 cB |
21.29 cB |
|
|
Maize |
12.97 aB |
5.82 aD |
16.11 aB |
323.94 aB |
40.88 aB |
13.55 aB |
7.15 aC |
13.60 aB |
263.04 aB |
29.31 aB |
|
|
5 |
Chickpea |
9.91 aD |
8.20 aB |
11.90 abC |
221.99 bC |
24.18 bC |
10.66 aC |
9.12 aB |
9.26 bC |
172.06 bC |
19.84 bC |
|
Mustard |
9.87 aD |
8.32 aB |
10.82 bcC |
195.76 cC |
19.07 cC |
10.98 aC |
9.33 aB |
9.00 bC |
160.06 bC |
17.58 cD |
|
|
Soybean |
10.10 aC |
9.73 aA |
8.58 cC |
183.77 cD |
15.92 dD |
10.79 aC |
9.38 aB |
8.16 bC |
129.49 cC |
16.70 cD |
|
|
Maize |
10.14 aD |
13.09 aA |
8.18 aC |
257.22 aD |
28.47 aD |
10.67 aC |
8.43 bB |
11.96 aB |
211.21 aC |
22.30 aD |
|
Note:Stages;1- pre-vegetation; 2- vegetative; 3- flowering; 4- maturation;5-post-harvest; MBC: microbial biomass carbon; MBN: microbial biomassnitrogen; MBP: microbial biomass phosphorous
|
1st year |
2nd year |
||||||||
|
Farming practice (FP) |
Organic Farming (OF) |
Conventional Farming (CF) |
Organic Farming (OF) |
Conventional Farming (CF) |
|||||
|
Stages |
Crop species |
Root biomass (g plant-1) |
Shoot biomass (g plant-1) |
Root biomass (g plant-1) |
Shoot biomass (g plant-1) |
Root biomass (g plant-1) |
Shoot biomass (g plant-1) |
Root biomass (g plant-1) |
Shoot biomass (g plant-1) |
|
1 |
Chickpea |
0.00 |
0.00 |
0.00 |
0.00 |
0.00 |
0.00 |
0.00 |
0.00 |
|
Mustard |
0.00 |
0.00 |
0.00 |
0.00 |
0.00 |
0.00 |
0.00 |
0.00 |
|
|
Soybean |
0.00 |
0.00 |
0.00 |
0.00 |
0.00 |
0.00 |
0.00 |
0.00 |
|
|
Maize |
0.00 |
0.00 |
0.00 |
0.00 |
0.00 |
0.00 |
0.00 |
0.00 |
|
|
2 |
Chickpea |
0.92 bC |
6.59 bC |
0.69 bC |
3.86 bC |
0.91 bC |
6.61 bC |
0.71 bC |
3.87 bC |
|
Mustard |
0.75 cC |
4.49 cC |
0.61 bcC |
3.51 bcC |
0.77 bC |
4.50 bC |
0.62 bcC |
3.53 bcC |
|
|
Soybean |
0.65 dA |
3.68 dA |
0.54 cB |
3.02 cB |
0.66 bA |
3.65 bA |
0.56 cB |
3.04 cB |
|
|
Maize |
1.79 aC |
10.39 aC |
1.47 aC |
8.79 aC |
1.81 aC |
10.40 aC |
1.48 aC |
8.81 aC |
|
|
3 |
Chickpea |
2.73 bA |
15.79 bA |
2.15 bA |
11.01 bA |
2.78 bA |
15.80 bA |
2.16 bA |
10.99 bA |
|
Mustard |
2.56 bA |
12.82 bA |
2.11 bA |
11.37 bA |
2.54 bA |
12.83 bA |
2.13 bA |
11.36 bA |
|
|
Soybean |
1.34 cA |
10.54 cA |
1.08 cA |
9.66 cA |
1.35 cA |
10.56 cA |
1.09 cA |
9.68 cA |
|
|
Maize |
4.11 aA |
37.20 aA |
2.49 aA |
32.35 aA |
4.09 aA |
37.23 aA |
2.51aA |
32.36 aA |
|
|
4 |
Chickpea |
1.84 bB |
9.59 bB |
1.37 cB |
7.89 cB |
1.85 bB |
9.65 bB |
1.38 cB |
7.90 cB |
|
Mustard |
1.69 cB |
8.55 cB |
1.52 bB |
8.02 bB |
1.70 cB |
8.56 cB |
1.53 bB |
8.04 bB |
|
|
Soybean |
1.23 dA |
8.11 dA |
1.11 dA |
7.83 dA |
1.23 dA |
8.10 dA |
1.11 dA |
7.85 dA |
|
|
Maize |
2.45 aB |
31.24 aB |
2.08 aB |
26.38 cB |
2.46 aB |
31.25 aB |
2.10 aB |
26.41 aB |
|
|
5 |
Chickpea |
0.00 |
0.00 |
0.00 |
0.00 |
0.00 |
0.00 |
0.00 |
0.00 |
|
Mustard |
0.00 |
0.00 |
0.00 |
0.00 |
0.00 |
0.00 |
0.00 |
0.00 |
|
|
Soybean |
0.00 |
0.00 |
0.00 |
0.00 |
0.00 |
0.00 |
0.00 |
0.00 |
|
|
Maize |
0.00 |
0.00 |
0.00 |
0.00 |
0.00 |
0.00 |
0.00 |
0.00 |
|
Note: Stages;1- pre-vegetation; 2- vegetative; 3- flowering; 4- maturation; 5-post-harvest
Effect of crop types and growth stages
A significant variation (p < 0.05) was observed between crop species and their growth stages for both ALP activity and phoD gene abundance. Total 16S rRNA gene abundance was also significantly (p < 0.05) varied between different crops and growth stages. The soil samples under the maize crop exhibited the highest ALP activity and phoD gene abundance followed by chickpea, mustard and least in soybean grown soils (Fig. 1 and 3). The previous studies have shown that the effect of different plant species on soil microorganisms display variability in plant physiological traits involving root exudates (Eisenhauer, 2017) which differ with varying crop and physiological stages (Bardgett, 1999; Grayston, 1998). This may be due to differences in plant root biomass between different crops. The plant root biomass was maximum in maize crop followed by chickpea, mustard and soybean (Table 3). This study shows maximum ALP enzyme activity and population of bacterial ALP genes in maize crop. The reason behind this may be because maize crops result in greater root biomass which may secrete enhanced root exudates and therefore have pronounced effects on microbial populations. This outcome is in accordance with those ofWang (2017) in which they reported that the plant root biomass showed a positive effect on soil microbial functions and structure.Neal (2021) also reported that crop types impose greater impact on the abundance of rhizosphere phosphohydrolase gene in Brazilian soils.
Furthermore, the crop growth stages also significantly (p < 0.05) affected the ALP activity, phoD gene and 16S rRNA abundance. The maximum abundance of alkaline phosphatase gene harboring bacteria was detected at the flowering stage (Fig. 3) followed by maturation > vegetative > post-harvest and least during the pre-vegetation stage in all the four test crops. The highest phoD gene copy number as observed at the flowering stage in all the crops distinctly indicates the enhancement of total and phoD bacterial gene abundance at the flowering stage of crop due to optimal availability of nutrients. The results corroborate the findings of others (Smalla, 2001) and also supports the findings of (Singh, 2013) which showed the influence of plant growth stage on 16S rRNA gene copy number and reported the similar trend to the present study. In contrary to the present study,Tamilselvi (2015) reported maximum total culturable bacteria in maize crops active during the vegetative growth stage and decreased thereafter at harvest. This discrepancy in the result could be accredited to the disparity in growth conditions, soil type, climatic condition, methods used.
Conclusion
The present study documents the impact of different farming practices, crops and their growth stages on variations in alkaline phosphatase (ALP) activity, abundance of 16S rRNA and phoD gene. The population of bacterial phoD gene and potential ALP activity decreased significantly under conventional farming practice. The phoD gene abundance was correlated positively to activity of ALP enzyme but negatively with soil available P. Also, different crop species and growth stages exhibited significant effects on changes in bacterial population size and enzymatic activity indicating variations in the rhizosphere chemistry of different crops and their growth stages. This study provides in deep insight into changes in phoD copy number to unravel the understanding of processes involved in phosphorous turnover in a tropical agroecosystem. The comparative study of phosphorous mobilizing bacterial abundance in organically and conventionally managed crops will provide opportunity for development of more P-efficient sustainable agriculture system. Outcome derived through this investigation will be useful to enhance the nutrient use efficiency of available P in agroecosystem.
Competing interests
The authors declare that they have no known competing financial interests or personal relationships that could have appeared to influence the work reported in this paper.